Molecule Information
General Information of the Molecule (ID: Mol00381)
| Name |
RNA-binding protein FUS (FUS)
,Homo sapiens
|
||||
|---|---|---|---|---|---|
| Synonyms |
75 kDa DNA-pairing protein; Oncogene FUS; Oncogene TLS; POMp75; Translocated in liposarcoma protein; TLS
Click to Show/Hide
|
||||
| Molecule Type |
Protein
|
||||
| Gene Name |
FUS
|
||||
| Gene ID | |||||
| Location |
chr16:31180138-31191605[+]
|
||||
| Sequence |
MASNDYTQQATQSYGAYPTQPGQGYSQQSSQPYGQQSYSGYSQSTDTSGYGQSSYSSYGQ
SQNTGYGTQSTPQGYGSTGGYGSSQSSQSSYGQQSSYPGYGQQPAPSSTSGSYGSSSQSS SYGQPQSGSYSQQPSYGGQQQSYGQQQSYNPPQGYGQQNQYNSSSGGGGGGGGGGNYGQD QSSMSSGGGSGGGYGNQDQSGGGGSGGYGQQDRGGRGRGGSGGGGGGGGGGYNRSSGGYE PRGRGGGRGGRGGMGGSDRGGFNKFGGPRDQGSRHDSEQDNSDNNTIFVQGLGENVTIES VADYFKQIGIIKTNKKTGQPMINLYTDRETGKLKGEATVSFDDPPSAKAAIDWFDGKEFS GNPIKVSFATRRADFNRGGGNGRGGRGRGGPMGRGGYGGGGSGGGGRGGFPSGGGGGGGQ QRAGDWKCPNPTCENMNFSWRNECNQCKAPKPDGPGGGPGGSHMGGNYGDDRRGGRGGYD RGGYRGRGGDRGGFRGGRGGGDRGGFGPGKMDSRGEHRQDRRERPY Click to Show/Hide
|
||||
| 3D-structure |
|
||||
| Function |
DNA/RNA-binding protein that plays a role in various cellular processes such as transcription regulation, RNA splicing, RNA transport, DNA repair and damage response. Binds to nascent pre-mRNAs and acts as a molecular mediator between RNA polymerase II and U1 small nuclear ribonucleoprotein thereby coupling transcription and splicing. Binds also its own pre-mRNA and autoregulates its expression; this autoregulation mechanism is mediated by non-sense-mediated decay. Plays a role in DNA repair mechanisms by promoting D-loop formation and homologous recombination during DNA double-strand break repair. In neuronal cells, plays crucial roles in dendritic spine formation and stability, RNA transport, mRNA stability and synaptic homeostasis.
Click to Show/Hide
|
||||
| Uniprot ID | |||||
| Ensembl ID | |||||
| HGNC ID | |||||
| Click to Show/Hide the Complete Species Lineage | |||||
Type(s) of Resistant Mechanism of This Molecule
Drug Resistance Data Categorized by Drug
Approved Drug(s)
1 drug(s) in total
| Drug Sensitivity Data Categorized by Their Corresponding Mechanisms | ||||
|
|
||||
| Disease Class: Neuroblastoma [ICD-11: 2A00.11] | [1] | |||
| Sensitive Disease | Neuroblastoma [ICD-11: 2A00.11] | |||
| Sensitive Drug | Cisplatin | |||
| Molecule Alteration | Expression | Down-regulation |
||
| Experimental Note | Revealed Based on the Cell Line Data | |||
| Cell Pathway Regulation | Cell migration | Inhibition | hsa04670 | |
| Cell proliferation | Inhibition | hsa05200 | ||
| In Vitro Model | IMR-32 cells | Abdomen | Homo sapiens (Human) | CVCL_0346 |
| Sk-N-AS cells | Adrenal | Homo sapiens (Human) | CVCL_1700 | |
| SH-SY5Y cells | Abdomen | Homo sapiens (Human) | CVCL_0019 | |
| Experiment for Molecule Alteration |
Western blot analysis | |||
| Experiment for Drug Resistance |
MTT assay | |||
| Mechanism Description | In the IMR-32 and SH-SY5Y cells, lentivirus-induced miR-141 upregulation inhibited cancer proliferation, cell cycle progression, migration and increased cisplatin chemosensitivity in vitro. In addition, miR-141 upregulation reduced the in vivo growth of IMR-32 tumor explants. FUS was found to be inversely regulated by miR-141 in NB. Small interfering RNA (siRNA)-induced FUS downregulation had similar tumor-suppressive effects as miR-141 upregulation on NB cell proliferation, cell cycle progression, migration and cisplatin chemosensitivity. | |||
Disease- and Tissue-specific Abundances of This Molecule
ICD Disease Classification 02

| Differential expression of molecule in resistant diseases | ||
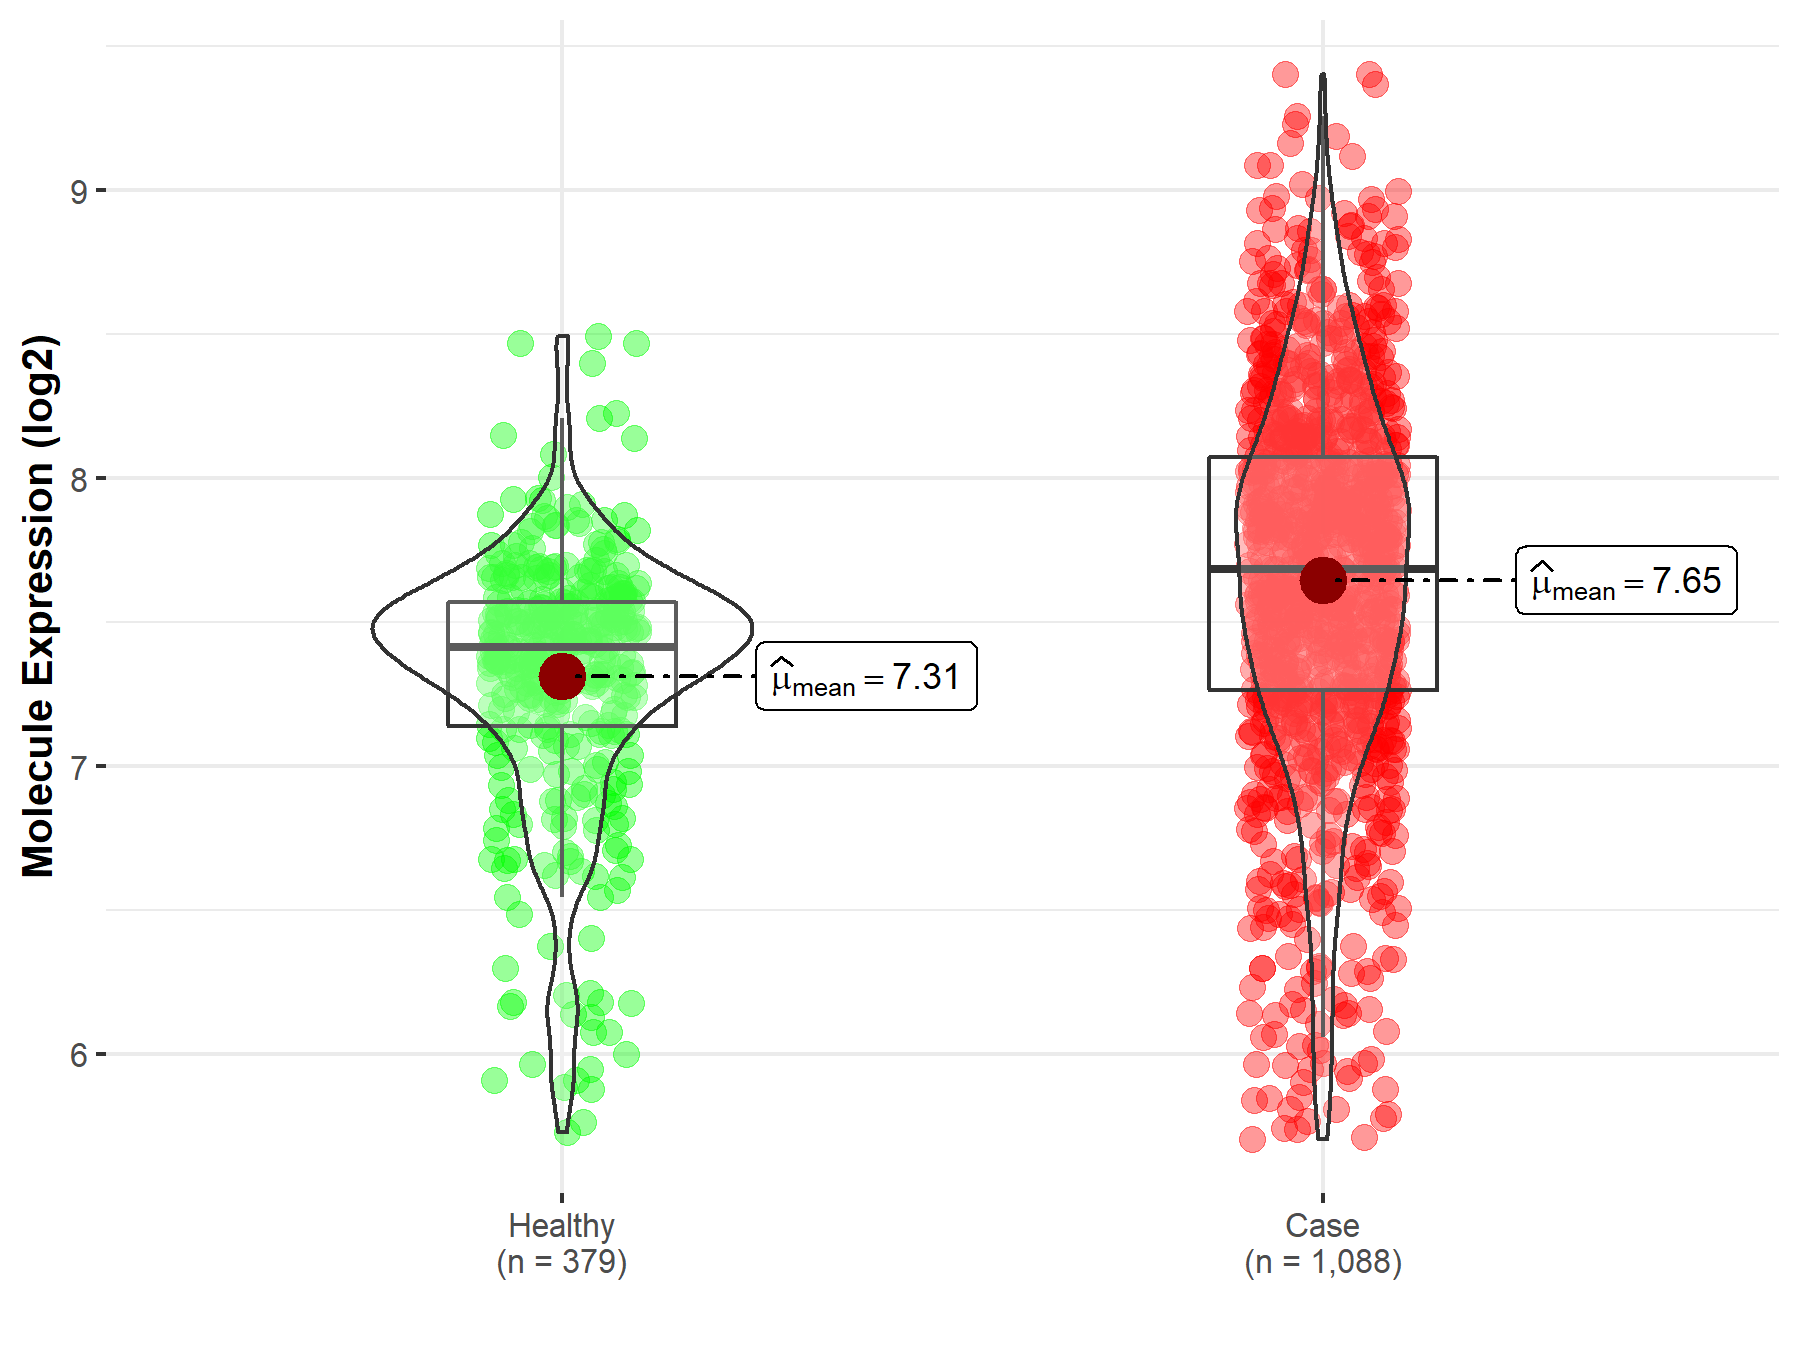
| The Studied Tissue | Nervous tissue | |
| The Specified Disease | Brain cancer | |
| The Expression Level of Disease Section Compare with the Healthy Individual Tissue | p-value: 5.91E-26; Fold-change: 2.71E-01; Z-score: 5.99E-01 | |
|
Molecule expression in the diseased tissue of patients
Molecule expression in the normal tissue of healthy individuals
|
||
| Disease-specific Molecule Abundances |

|
Click to View the Clearer Original Diagram |
| The Studied Tissue | Brainstem tissue | |
| The Specified Disease | Glioma | |
| The Expression Level of Disease Section Compare with the Healthy Individual Tissue | p-value: 1.23E-01; Fold-change: 1.05E+00; Z-score: 2.70E+00 | |
|
Molecule expression in the diseased tissue of patients
Molecule expression in the normal tissue of healthy individuals
|
||
| Disease-specific Molecule Abundances |

|
Click to View the Clearer Original Diagram |
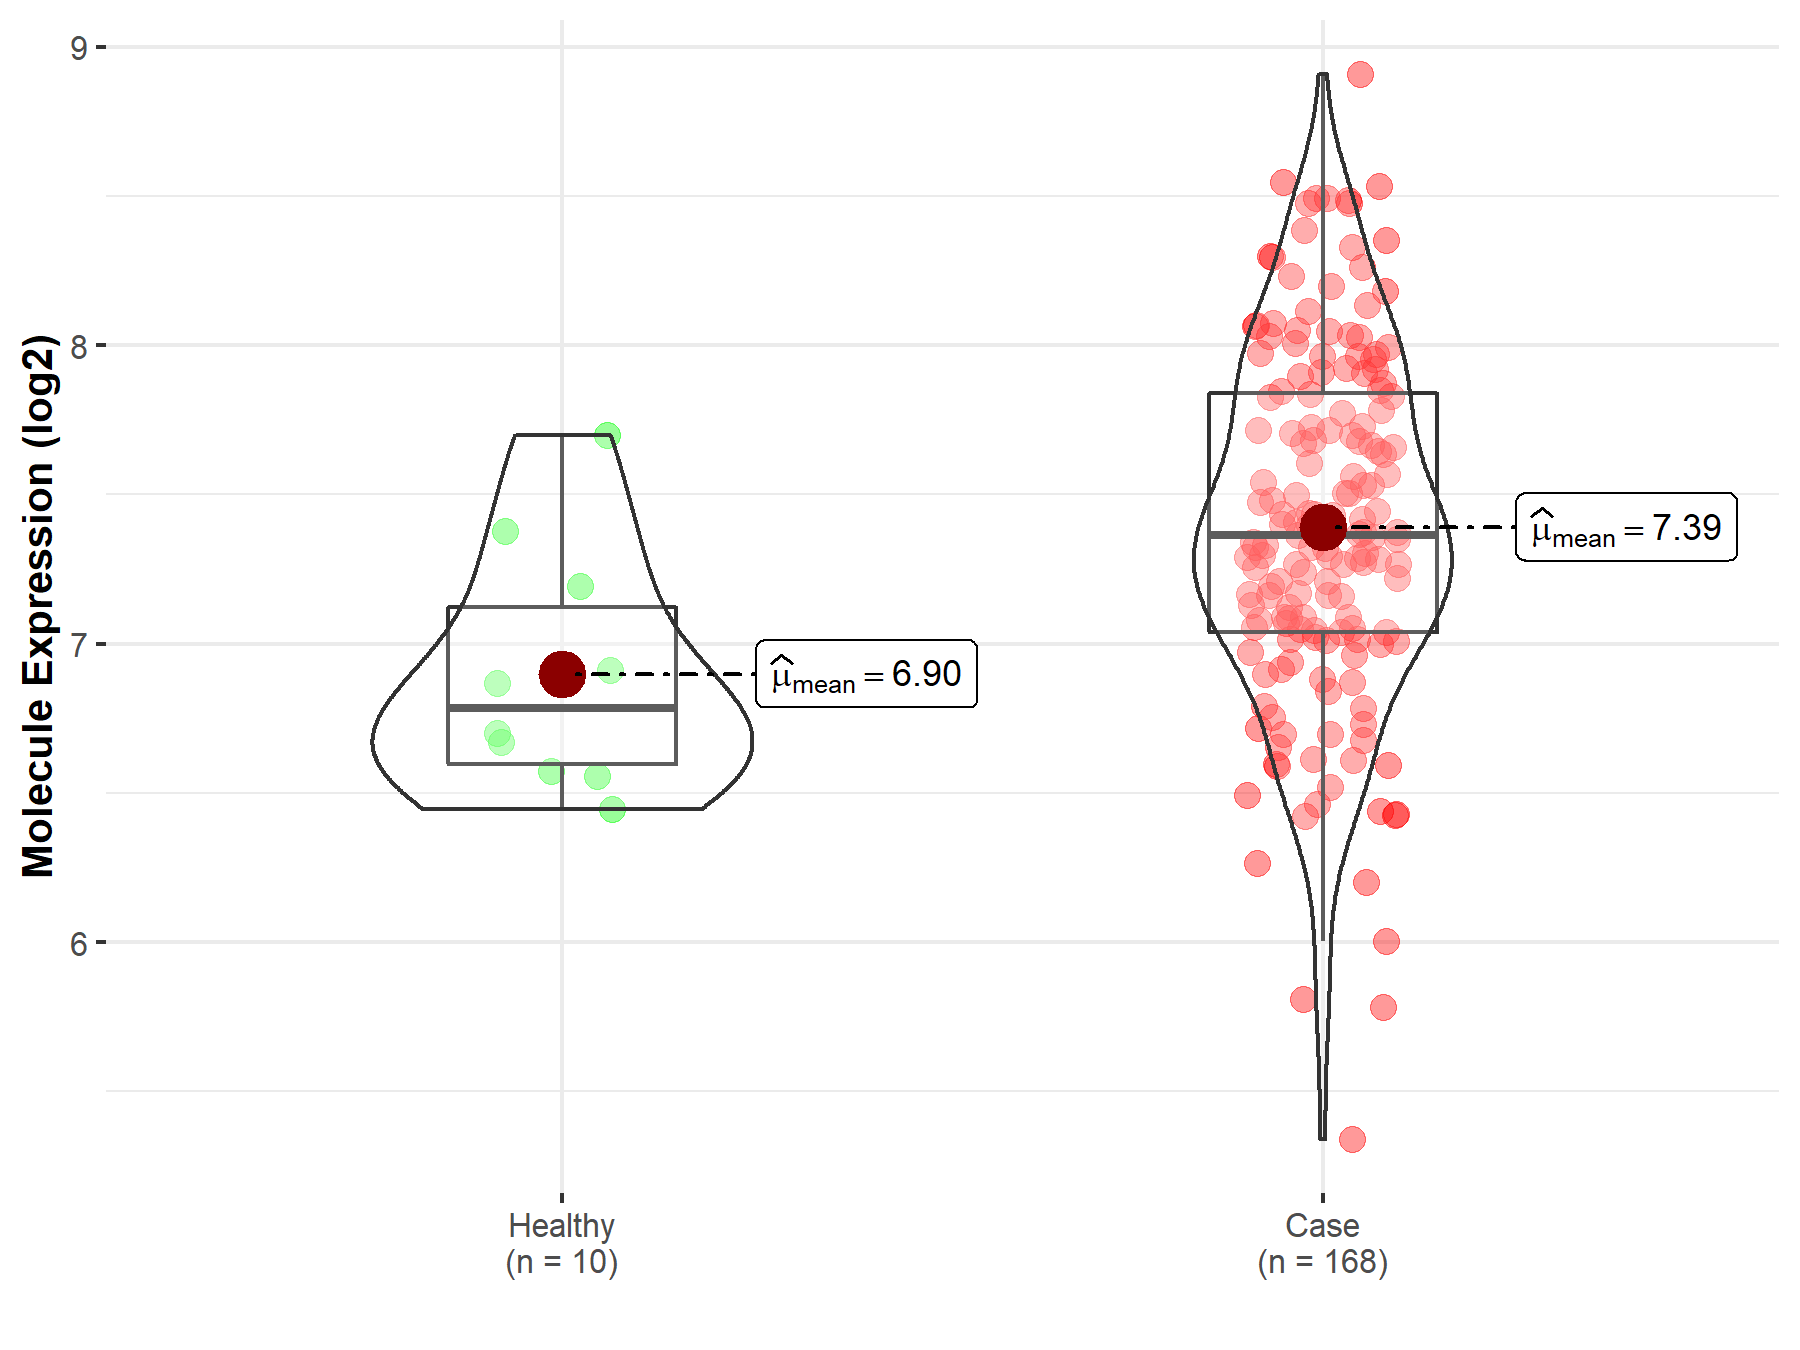
| The Studied Tissue | White matter | |
| The Specified Disease | Glioma | |
| The Expression Level of Disease Section Compare with the Healthy Individual Tissue | p-value: 2.31E-03; Fold-change: 2.65E-01; Z-score: 8.20E-01 | |
|
Molecule expression in the diseased tissue of patients
Molecule expression in the normal tissue of healthy individuals
|
||
| Disease-specific Molecule Abundances |

|
Click to View the Clearer Original Diagram |
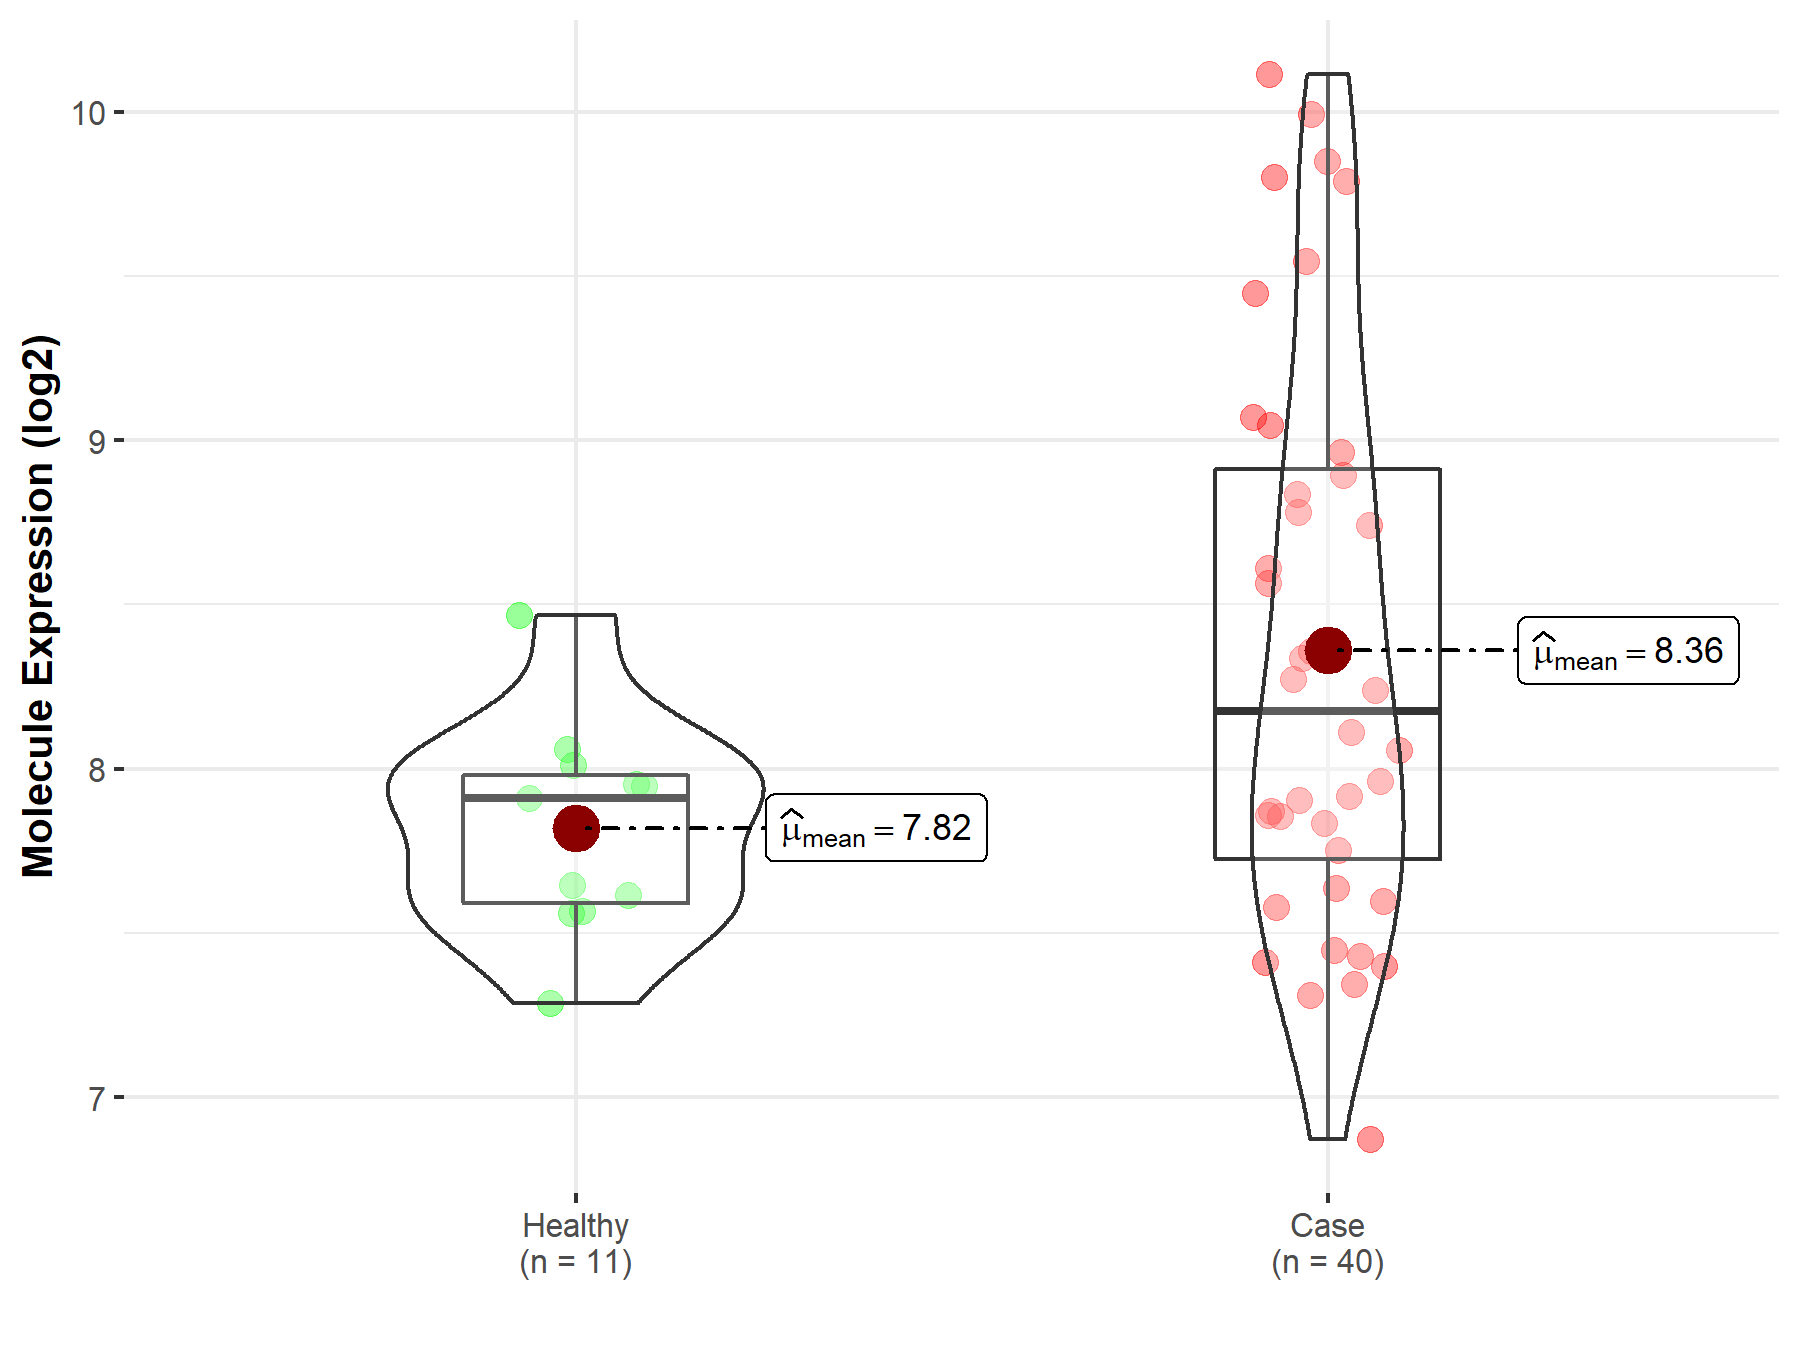
| The Studied Tissue | Brainstem tissue | |
| The Specified Disease | Neuroectodermal tumor | |
| The Expression Level of Disease Section Compare with the Healthy Individual Tissue | p-value: 3.83E-03; Fold-change: 5.82E-01; Z-score: 1.43E+00 | |
|
Molecule expression in the diseased tissue of patients
Molecule expression in the normal tissue of healthy individuals
|
||
| Disease-specific Molecule Abundances |

|
Click to View the Clearer Original Diagram |
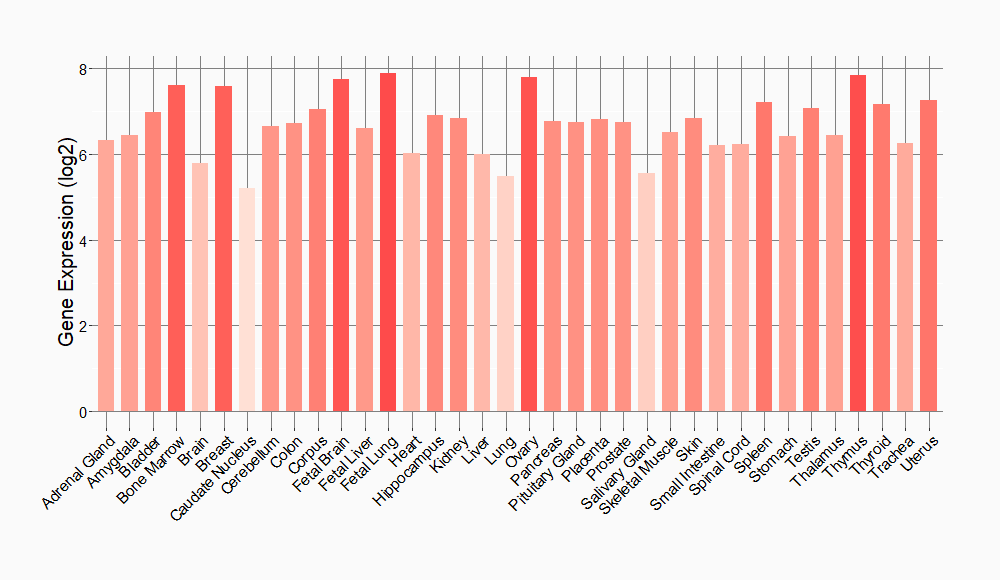
Tissue-specific Molecule Abundances in Healthy Individuals


|
||
References
If you find any error in data or bug in web service, please kindly report it to Dr. Sun and Dr. Yu.
