Molecule Information
General Information of the Molecule (ID: Mol00355)
| Name |
ERBB receptor feedback inhibitor 1 (ERRFI1)
,Homo sapiens
|
||||
|---|---|---|---|---|---|
| Synonyms |
Mitogen-inducible gene 6 protein; MIG-6; MIG6
Click to Show/Hide
|
||||
| Molecule Type |
Protein
|
||||
| Gene Name |
ERRFI1
|
||||
| Gene ID | |||||
| Location |
chr1:8004404-8026309[-]
|
||||
| Sequence |
MSIAGVAAQEIRVPLKTGFLHNGRAMGNMRKTYWSSRSEFKNNFLNIDPITMAYSLNSSA
QERLIPLGHASKSAPMNGHCFAENGPSQKSSLPPLLIPPSENLGPHEEDQVVCGFKKLTV NGVCASTPPLTPIKNSPSLFPCAPLCERGSRPLPPLPISEALSLDDTDCEVEFLTSSDTD FLLEDSTLSDFKYDVPGRRSFRGCGQINYAYFDTPAVSAADLSYVSDQNGGVPDPNPPPP QTHRRLRRSHSGPAGSFNKPAIRISNCCIHRASPNSDEDKPEVPPRVPIPPRPVKPDYRR WSAEVTSSTYSDEDRPPKVPPREPLSPSNSRTPSPKSLPSYLNGVMPPTQSFAPDPKYVS SKALQRQNSEGSASKVPCILPIIENGKKVSSTHYYLLPERPPYLDKYEKFFREAEETNGG AQIQPLPADCGISSATEKPDSKTKMDLGGHVKRKHLSYVVSP Click to Show/Hide
|
||||
| 3D-structure |
|
||||
| Function |
Negative regulator of EGFR signaling in skin morphogenesis. Acts as a negative regulator for several EGFR family members, including ERBB2, ERBB3 and ERBB4. Inhibits EGFR catalytic activity by interfering with its dimerization. Inhibits autophosphorylation of EGFR, ERBB2 and ERBB4. Important for normal keratinocyte proliferation and differentiation. Plays a role in modulating the response to steroid hormones in the uterus. Required for normal response to progesterone in the uterus and for fertility. Mediates epithelial estrogen responses in the uterus by regulating ESR1 levels and activation. Important for regulation of endometrium cell proliferation. Important for normal prenatal and perinatal lung development (By similarity).
Click to Show/Hide
|
||||
| Uniprot ID | |||||
| Ensembl ID | |||||
| HGNC ID | |||||
| Click to Show/Hide the Complete Species Lineage | |||||
Type(s) of Resistant Mechanism of This Molecule
Drug Resistance Data Categorized by Drug
Approved Drug(s)
2 drug(s) in total
| Drug Sensitivity Data Categorized by Their Corresponding Mechanisms | ||||
|
|
||||
| Disease Class: Bladder cancer [ICD-11: 2C94.0] | [1] | |||
| Sensitive Disease | Bladder cancer [ICD-11: 2C94.0] | |||
| Sensitive Drug | Cetuximab | |||
| Molecule Alteration | Expression | Down-regulation |
||
| Experimental Note | Revealed Based on the Cell Line Data | |||
| Cell Pathway Regulation | EGFR signaling pathway | Regulation | N.A. | |
| In Vitro Model | 253J BV cells | Bladder | Homo sapiens (Human) | CVCL_7937 |
| Experiment for Molecule Alteration |
Immunoblotting analysis | |||
| Experiment for Drug Resistance |
Pulse-labeling cells with [3H]thymidine | |||
| Mechanism Description | Members of the miR-200 family appear to control the EMT process and sensitivity to EGFR therapy, in bladder cancer cells and that expression of miR-200 is sufficient to restore EGFR dependency, at least in some of the mesenchymal bladder cancer cells. The targets of miR-200 include ERRFI-1, which is a novel regulator of EGFR-independent growth. | |||
| Drug Sensitivity Data Categorized by Their Corresponding Mechanisms | ||||
|
|
||||
| Disease Class: Non-small cell lung cancer [ICD-11: 2C25.Y] | [2] | |||
| Sensitive Disease | Non-small cell lung cancer [ICD-11: 2C25.Y] | |||
| Sensitive Drug | Erlotinib | |||
| Molecule Alteration | Expression | Down-regulation |
||
| Experimental Note | Revealed Based on the Cell Line Data | |||
| Cell Pathway Regulation | Cell proliferation | Inhibition | hsa05200 | |
| TGF-Beta/miR200/MIG6 signaling pathway | Inhibition | hsa05206 | ||
| In Vitro Model | Calu3 cells | Lung | Homo sapiens (Human) | CVCL_0609 |
| H292 cells | Lung | Homo sapiens (Human) | CVCL_0455 | |
| A549 cells | Lung | Homo sapiens (Human) | CVCL_0023 | |
| H460 cells | Lung | Homo sapiens (Human) | CVCL_0459 | |
| H1299 cells | Lung | Homo sapiens (Human) | CVCL_0060 | |
| NCI-H358 cells | Lung | Homo sapiens (Human) | CVCL_1559 | |
| NCl-H226 cells | Lung | Homo sapiens (Human) | CVCL_1544 | |
| NCl-H1437 cells | Lung | Homo sapiens (Human) | CVCL_1472 | |
| H1703 cells | Lung | Homo sapiens (Human) | CVCL_1490 | |
| H23 cells | Lung | Homo sapiens (Human) | CVCL_1547 | |
| Calu6 cells | Lung | Homo sapiens (Human) | CVCL_0236 | |
| H1838 cells | Lung | Homo sapiens (Human) | CVCL_1499 | |
| H1915 cells | Lung | Homo sapiens (Human) | CVCL_1505 | |
| Experiment for Molecule Alteration |
Western blot analysis | |||
| Experiment for Drug Resistance |
Alamar Blue assay | |||
| Mechanism Description | The Mig6-mediated reduction of EGFR occurs concomitantly with a TGFbeta-induced EMT-associated kinase switch of tumor cells to an AkT-activated state, thereby leading to an EGFR-independent phenotype that is refractory to EGFR TkI. the ratio of the expression levels of Mig6 and miR200c is highly correlated with EMT and resistance to erlotinib. Moreover, analyses of primary tumor xenografts of patient-derived lung and pancreatic cancers carrying wild type EGFR showed that the tumor Mig6(mRNA)/miR200 ratio is inversely correlated with response to erlotinib in vivo. | |||
| Disease Class: Bladder cancer [ICD-11: 2C94.0] | [2] | |||
| Sensitive Disease | Bladder cancer [ICD-11: 2C94.0] | |||
| Sensitive Drug | Erlotinib | |||
| Molecule Alteration | Expression | Down-regulation |
||
| Experimental Note | Revealed Based on the Cell Line Data | |||
| Cell Pathway Regulation | Cell proliferation | Inhibition | hsa05200 | |
| TGF-Beta/miR200/MIG6 signaling pathway | Inhibition | hsa05206 | ||
| In Vitro Model | Calu3 cells | Lung | Homo sapiens (Human) | CVCL_0609 |
| H292 cells | Lung | Homo sapiens (Human) | CVCL_0455 | |
| A549 cells | Lung | Homo sapiens (Human) | CVCL_0023 | |
| H460 cells | Lung | Homo sapiens (Human) | CVCL_0459 | |
| H1299 cells | Lung | Homo sapiens (Human) | CVCL_0060 | |
| NCI-H358 cells | Lung | Homo sapiens (Human) | CVCL_1559 | |
| NCl-H226 cells | Lung | Homo sapiens (Human) | CVCL_1544 | |
| NCl-H1437 cells | Lung | Homo sapiens (Human) | CVCL_1472 | |
| H1703 cells | Lung | Homo sapiens (Human) | CVCL_1490 | |
| H23 cells | Lung | Homo sapiens (Human) | CVCL_1547 | |
| Calu6 cells | Lung | Homo sapiens (Human) | CVCL_0236 | |
| H1838 cells | Lung | Homo sapiens (Human) | CVCL_1499 | |
| H1915 cells | Lung | Homo sapiens (Human) | CVCL_1505 | |
| Experiment for Molecule Alteration |
Western blot analysis | |||
| Experiment for Drug Resistance |
Alamar Blue assay | |||
| Mechanism Description | The Mig6-mediated reduction of EGFR occurs concomitantly with a TGFbeta-induced EMT-associated kinase switch of tumor cells to an AkT-activated state, thereby leading to an EGFR-independent phenotype that is refractory to EGFR TkI. the ratio of the expression levels of Mig6 and miR200c is highly correlated with EMT and resistance to erlotinib. Moreover, analyses of primary tumor xenografts of patient-derived lung and pancreatic cancers carrying wild type EGFR showed that the tumor Mig6(mRNA)/miR200 ratio is inversely correlated with response to erlotinib in vivo. | |||
Disease- and Tissue-specific Abundances of This Molecule
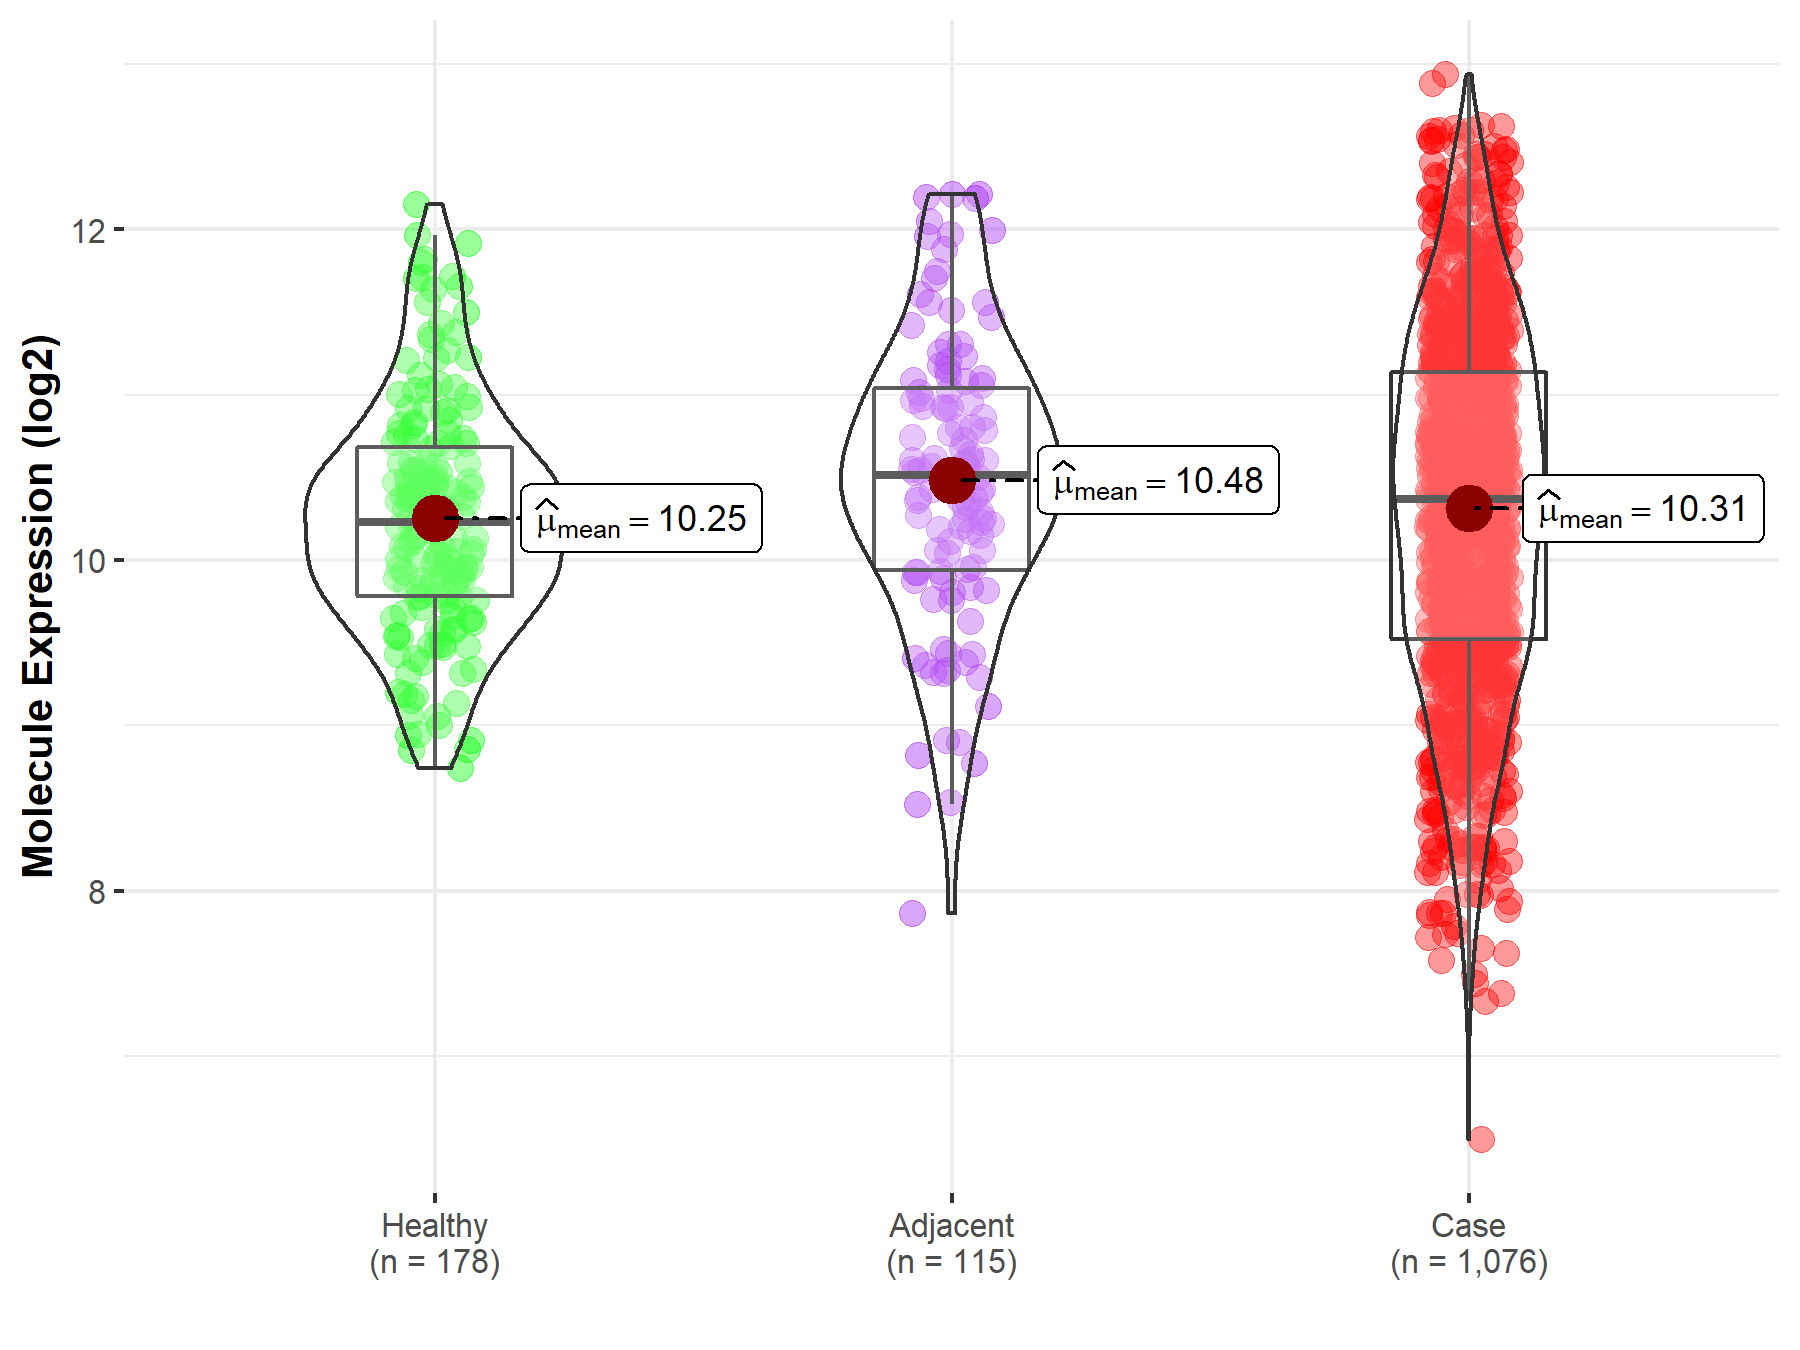
ICD Disease Classification 02

| Differential expression of molecule in resistant diseases | ||
| The Studied Tissue | Lung | |
| The Specified Disease | Lung cancer | |
| The Expression Level of Disease Section Compare with the Healthy Individual Tissue | p-value: 3.40E-01; Fold-change: 1.35E-01; Z-score: 1.90E-01 | |
| The Expression Level of Disease Section Compare with the Adjacent Tissue | p-value: 5.33E-02; Fold-change: -1.48E-01; Z-score: -1.69E-01 | |
|
Molecule expression in the normal tissue adjacent to the diseased tissue of patients
Molecule expression in the diseased tissue of patients
Molecule expression in the normal tissue of healthy individuals
|
||
| Disease-specific Molecule Abundances |

|
Click to View the Clearer Original Diagram |
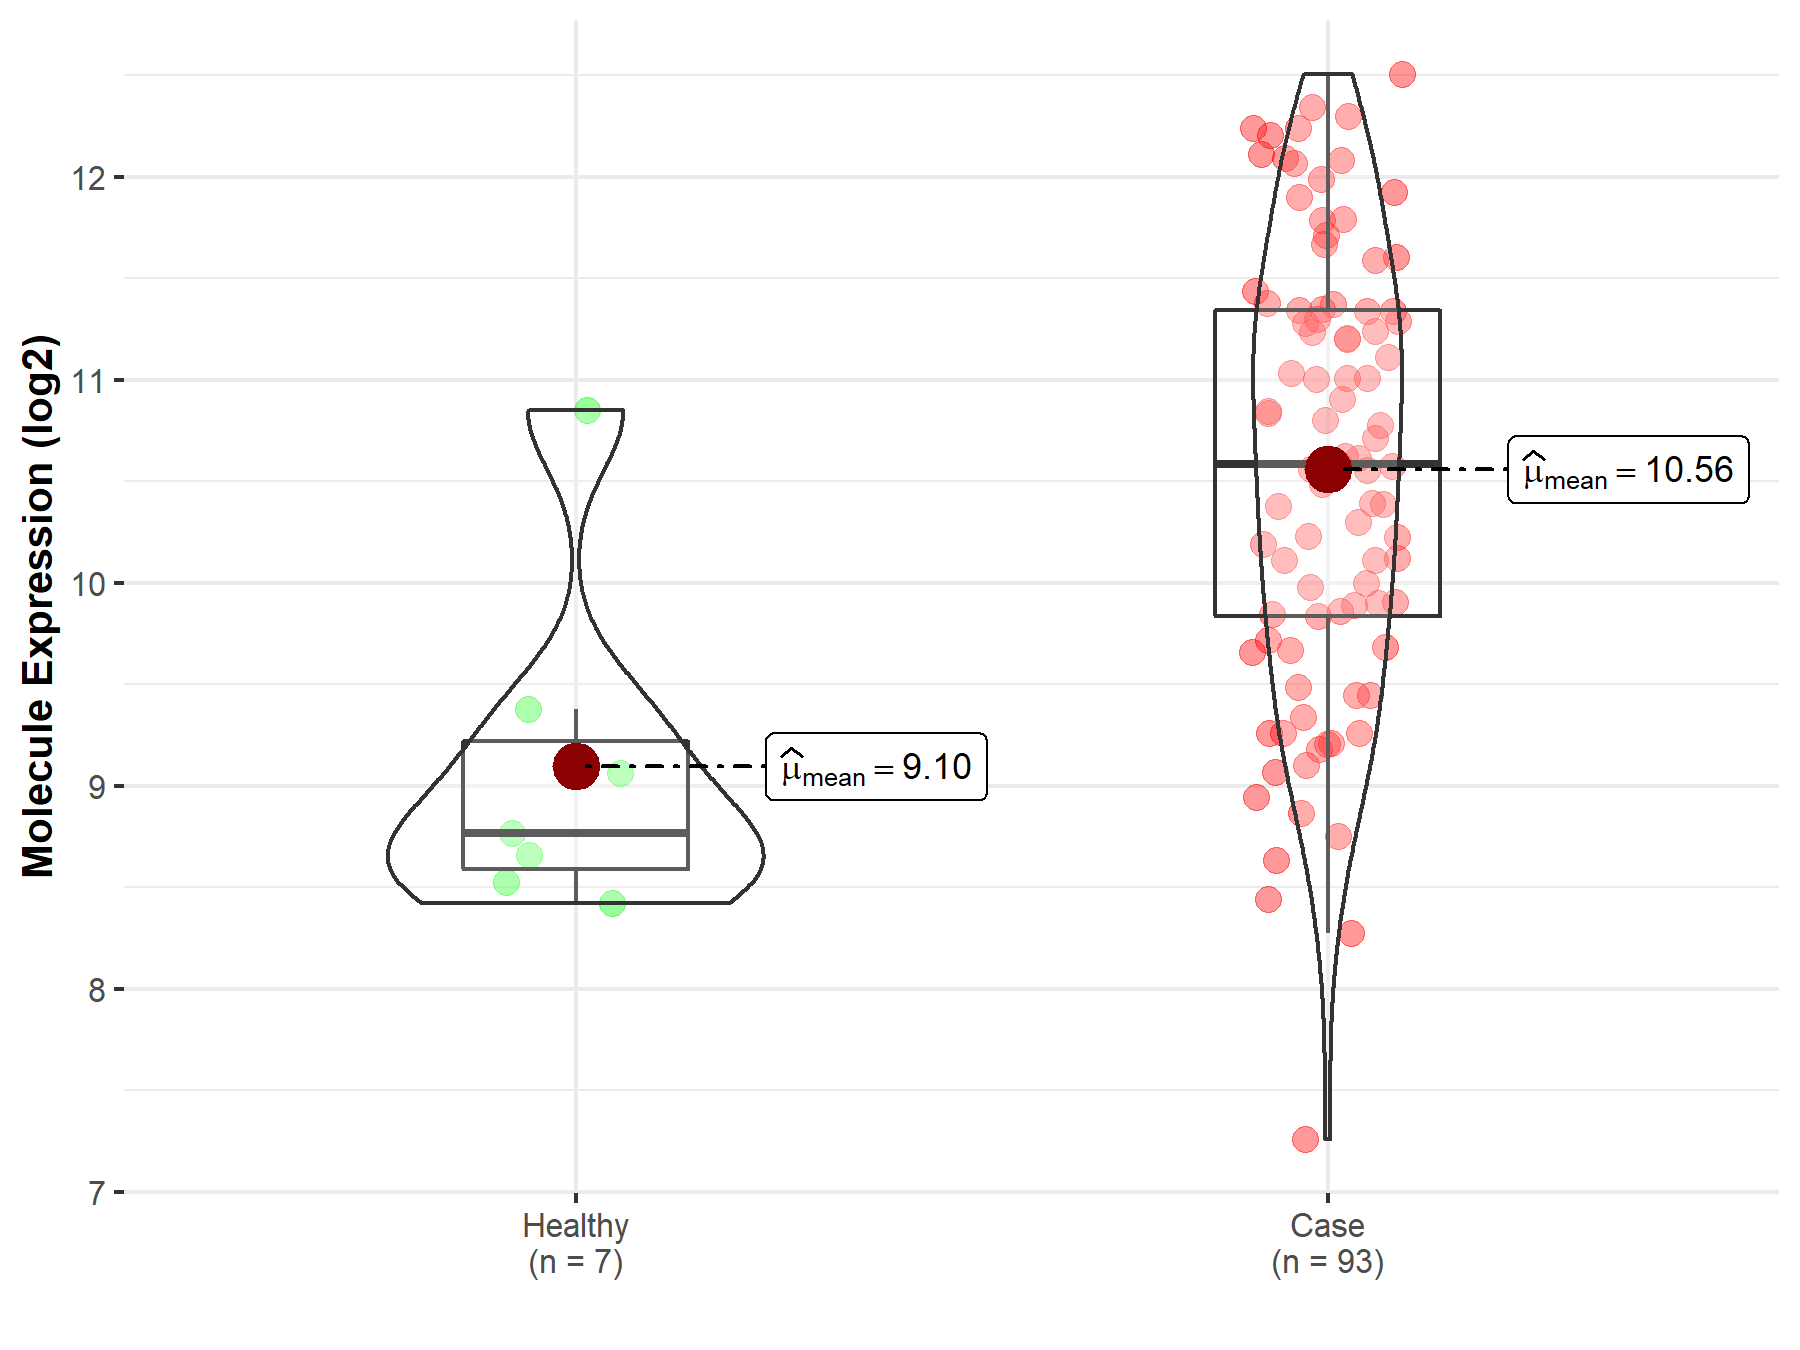
| Differential expression of molecule in resistant diseases | ||
| The Studied Tissue | Bladder tissue | |
| The Specified Disease | Bladder cancer | |
| The Expression Level of Disease Section Compare with the Healthy Individual Tissue | p-value: 2.77E-03; Fold-change: 1.81E+00; Z-score: 2.16E+00 | |
|
Molecule expression in the diseased tissue of patients
Molecule expression in the normal tissue of healthy individuals
|
||
| Disease-specific Molecule Abundances |

|
Click to View the Clearer Original Diagram |
References
If you find any error in data or bug in web service, please kindly report it to Dr. Sun and Dr. Yu.
