Molecule Information
General Information of the Molecule (ID: Mol00336)
| Name |
Transcription factor E2F1 (E2F1)
,Homo sapiens
|
||||
|---|---|---|---|---|---|
| Synonyms |
E2F-1; PBR3; Retinoblastoma-associated protein 1; RBAP-1; Retinoblastoma-binding protein 3; RBBP-3; pRB-binding protein E2F-1; RBBP3
Click to Show/Hide
|
||||
| Molecule Type |
Protein
|
||||
| Gene Name |
E2F1
|
||||
| Gene ID | |||||
| Location |
chr20:33675477-33686385[-]
|
||||
| 3D-structure |
|
||||
| Uniprot ID | |||||
| Ensembl ID | |||||
| HGNC ID | |||||
| Click to Show/Hide the Complete Species Lineage | |||||
Type(s) of Resistant Mechanism of This Molecule
 UAPP: Unusual Activation of Pro-survival Pathway
Drug Resistance Data Categorized by Drug
Approved Drug(s)
5 drug(s) in total
| Drug Sensitivity Data Categorized by Their Corresponding Mechanisms | ||||
|
Unusual Activation of Pro-survival Pathway (UAPP)
|
||||
| Disease Class: Glioma [ICD-11: 2A00.1] | [1] | |||
| Sensitive Disease | Glioma [ICD-11: 2A00.1] | |||
| Sensitive Drug | Temozolomide | |||
| Molecule Alteration | Expression | Down-regulation |
||
| Differential expression of the molecule in resistant disease | ||||
| Classification of Disease | Brain cancer [ICD-11: 2A00] | |||
| The Specified Disease | Brain cancer | |||
| The Studied Tissue | Nervous tissue | |||
| The Expression Level of Disease Section Compare with the Healthy Individual Tissue | p-value: 5.94E-01 Fold-change: -2.14E-03 Z-score: -5.34E-01 |
|||
| Experimental Note | Revealed Based on the Cell Line Data | |||
| Cell Pathway Regulation | Cell apoptosis | Activation | hsa04210 | |
| Cell colony | Inhibition | hsa05200 | ||
| Cell proliferation | Inhibition | hsa05200 | ||
| In Vitro Model | U251 cells | Brain | Homo sapiens (Human) | CVCL_0021 |
| U87 cells | Brain | Homo sapiens (Human) | CVCL_0022 | |
| Experiment for Molecule Alteration |
Western blot analysis | |||
| Experiment for Drug Resistance |
CCK8 assay; Flow cytometry assay | |||
| Mechanism Description | Down-regulation of miR-196b increased glioma cell sensitivity to TMZ and E2F1 decreased following transfection with miR-196b inhibitors. | |||
| Drug Sensitivity Data Categorized by Their Corresponding Mechanisms | ||||
|
Unusual Activation of Pro-survival Pathway (UAPP)
|
||||
| Disease Class: Breast cancer [ICD-11: 2C60.3] | [2] | |||
| Sensitive Disease | Breast cancer [ICD-11: 2C60.3] | |||
| Sensitive Drug | Cisplatin | |||
| Molecule Alteration | Expression | Down-regulation |
||
| Experimental Note | Revealed Based on the Cell Line Data | |||
| Cell Pathway Regulation | Cell apoptosis | Activation | hsa04210 | |
| Cell proliferation | Inhibition | hsa05200 | ||
| In Vitro Model | MDA-MB-231 cells | Breast | Homo sapiens (Human) | CVCL_0062 |
| T47D cells | Breast | Homo sapiens (Human) | CVCL_0553 | |
| BT549 cells | Breast | Homo sapiens (Human) | CVCL_1092 | |
| Experiment for Molecule Alteration |
Western blot analysis | |||
| Experiment for Drug Resistance |
MTS assay; Trypan blue stain assay | |||
| Mechanism Description | miR-302b overexpression enhances sensitivity to cisplatin in breast cancer cell lines, reducing cell viability and proliferation in response to the treatment. We also identified E2F1, a master regulator of the G1/S transition, as a direct target gene of miR-302b. E2F1 transcriptionally activates ATM, the main cellular sensor of DNA damage. Through the negative regulation of E2F1, miR-302b indirectly affects ATM expression, abrogating cell-cycle progression upon cisplatin treatment. Moreover miR-302b, impairs the ability of breast cancer cells to repair damaged DNA, enhancing apoptosis activation following cisplatin treatment. | |||
| Drug Sensitivity Data Categorized by Their Corresponding Mechanisms | ||||
|
Unusual Activation of Pro-survival Pathway (UAPP)
|
||||
| Disease Class: Leukemia [ICD-11: 2B33.6] | [3] | |||
| Sensitive Disease | Leukemia [ICD-11: 2B33.6] | |||
| Sensitive Drug | Doxorubicin | |||
| Molecule Alteration | Expression | Down-regulation |
||
| Experimental Note | Revealed Based on the Cell Line Data | |||
| In Vitro Model | K562 cells | Blood | Homo sapiens (Human) | CVCL_0004 |
| K562/A02 cells | Blood | Homo sapiens (Human) | CVCL_0368 | |
| Experiment for Molecule Alteration |
RT-PCR; Western blot analysis | |||
| Experiment for Drug Resistance |
CCK8 assay | |||
| Mechanism Description | The targeted upregulated expression of miR98 could decrease the proliferation of leukemia cells and improve the sensitivity to chemotherapeutics by inhibiting E2F1 expression. | |||
| Drug Sensitivity Data Categorized by Their Corresponding Mechanisms | ||||
|
Unusual Activation of Pro-survival Pathway (UAPP)
|
||||
| Disease Class: Hepatocellular carcinoma [ICD-11: 2C12.2] | [4] | |||
| Sensitive Disease | Hepatocellular carcinoma [ICD-11: 2C12.2] | |||
| Sensitive Drug | Fluorouracil | |||
| Molecule Alteration | Expression | Down-regulation |
||
| Experimental Note | Revealed Based on the Cell Line Data | |||
| Cell Pathway Regulation | Cell apoptosis | Activation | hsa04210 | |
| In Vitro Model | BEL-7402 cells | Liver | Homo sapiens (Human) | CVCL_5492 |
| HepG2 cells | Liver | Homo sapiens (Human) | CVCL_0027 | |
| Hep3B cells | Liver | Homo sapiens (Human) | CVCL_0326 | |
| QGY-7703 cells | Liver | Homo sapiens (Human) | CVCL_6715 | |
| SMMC7721 cells | Uterus | Homo sapiens (Human) | CVCL_0534 | |
| PLC cells | Liver | Homo sapiens (Human) | CVCL_0485 | |
| FOCUS cells | Liver | Homo sapiens (Human) | CVCL_7955 | |
| YY-8103 cells | Liver | Homo sapiens (Human) | CVCL_WY40 | |
| In Vivo Model | Nude mouse xenograft model | Mus musculus | ||
| Experiment for Molecule Alteration |
ELISA assay | |||
| Experiment for Drug Resistance |
Flow cytometry assay | |||
| Mechanism Description | SRSF2 preferentially up-regulates the proapoptotic splicing form of caspase 2 (CASP2L) and sensitizes HCC cells to 5-FU. miR-193a-3p Dictates Resistance of Hepatocellular Carcinoma to 5-Fluorouracil via Repression of SRSF2 Expression. | |||
| Drug Resistance Data Categorized by Their Corresponding Mechanisms | ||||
|
Unusual Activation of Pro-survival Pathway (UAPP)
|
||||
| Disease Class: Gastric cancer [ICD-11: 2B72.1] | [5] | |||
| Resistant Disease | Gastric cancer [ICD-11: 2B72.1] | |||
| Resistant Drug | Oxaliplatin | |||
| Molecule Alteration | Expression | Down-regulation |
||
| Experimental Note | Identified from the Human Clinical Data | |||
| Cell Pathway Regulation | Sp1/DAPK2 signaling signaling pathway | Inhibition | hsa05231 | |
| In Vitro Model | MGC-803 cells | Gastric | Homo sapiens (Human) | CVCL_5334 |
| SGC7901 cells | Gastric | Homo sapiens (Human) | CVCL_0520 | |
| NCI-N87 cells | Gastric | Homo sapiens (Human) | CVCL_1603 | |
| MGC-803/OXA cells | Gastric | Homo sapiens (Human) | CVCL_5334 | |
| SGC7901/OXA cells | Gastric | Homo sapiens (Human) | CVCL_B0A1 | |
| SNU-5 cells | Gastric | Homo sapiens (Human) | CVCL_0078 | |
| In Vivo Model | Nude mouse xenograft model | Mus musculus | ||
| Experiment for Molecule Alteration |
Western blot analysis | |||
| Experiment for Drug Resistance |
CCK8 assay; Flow cytometry assay | |||
| Mechanism Description | miR135a promotes gastric cancer progression and resistance to oxaliplatin. The mechanism whereby miR135a promotes GC pathogenesis appears to be the suppression of E2F1 expression and Sp1/DAPk2 pathway signaling. | |||
Disease- and Tissue-specific Abundances of This Molecule
ICD Disease Classification 02

| Differential expression of molecule in resistant diseases | ||
| The Studied Tissue | Nervous tissue | |
| The Specified Disease | Brain cancer | |
| The Expression Level of Disease Section Compare with the Healthy Individual Tissue | p-value: 5.94E-01; Fold-change: -1.14E-01; Z-score: -5.05E-01 | |
|
Molecule expression in the diseased tissue of patients
Molecule expression in the normal tissue of healthy individuals
|
||
| Disease-specific Molecule Abundances |

|
Click to View the Clearer Original Diagram |
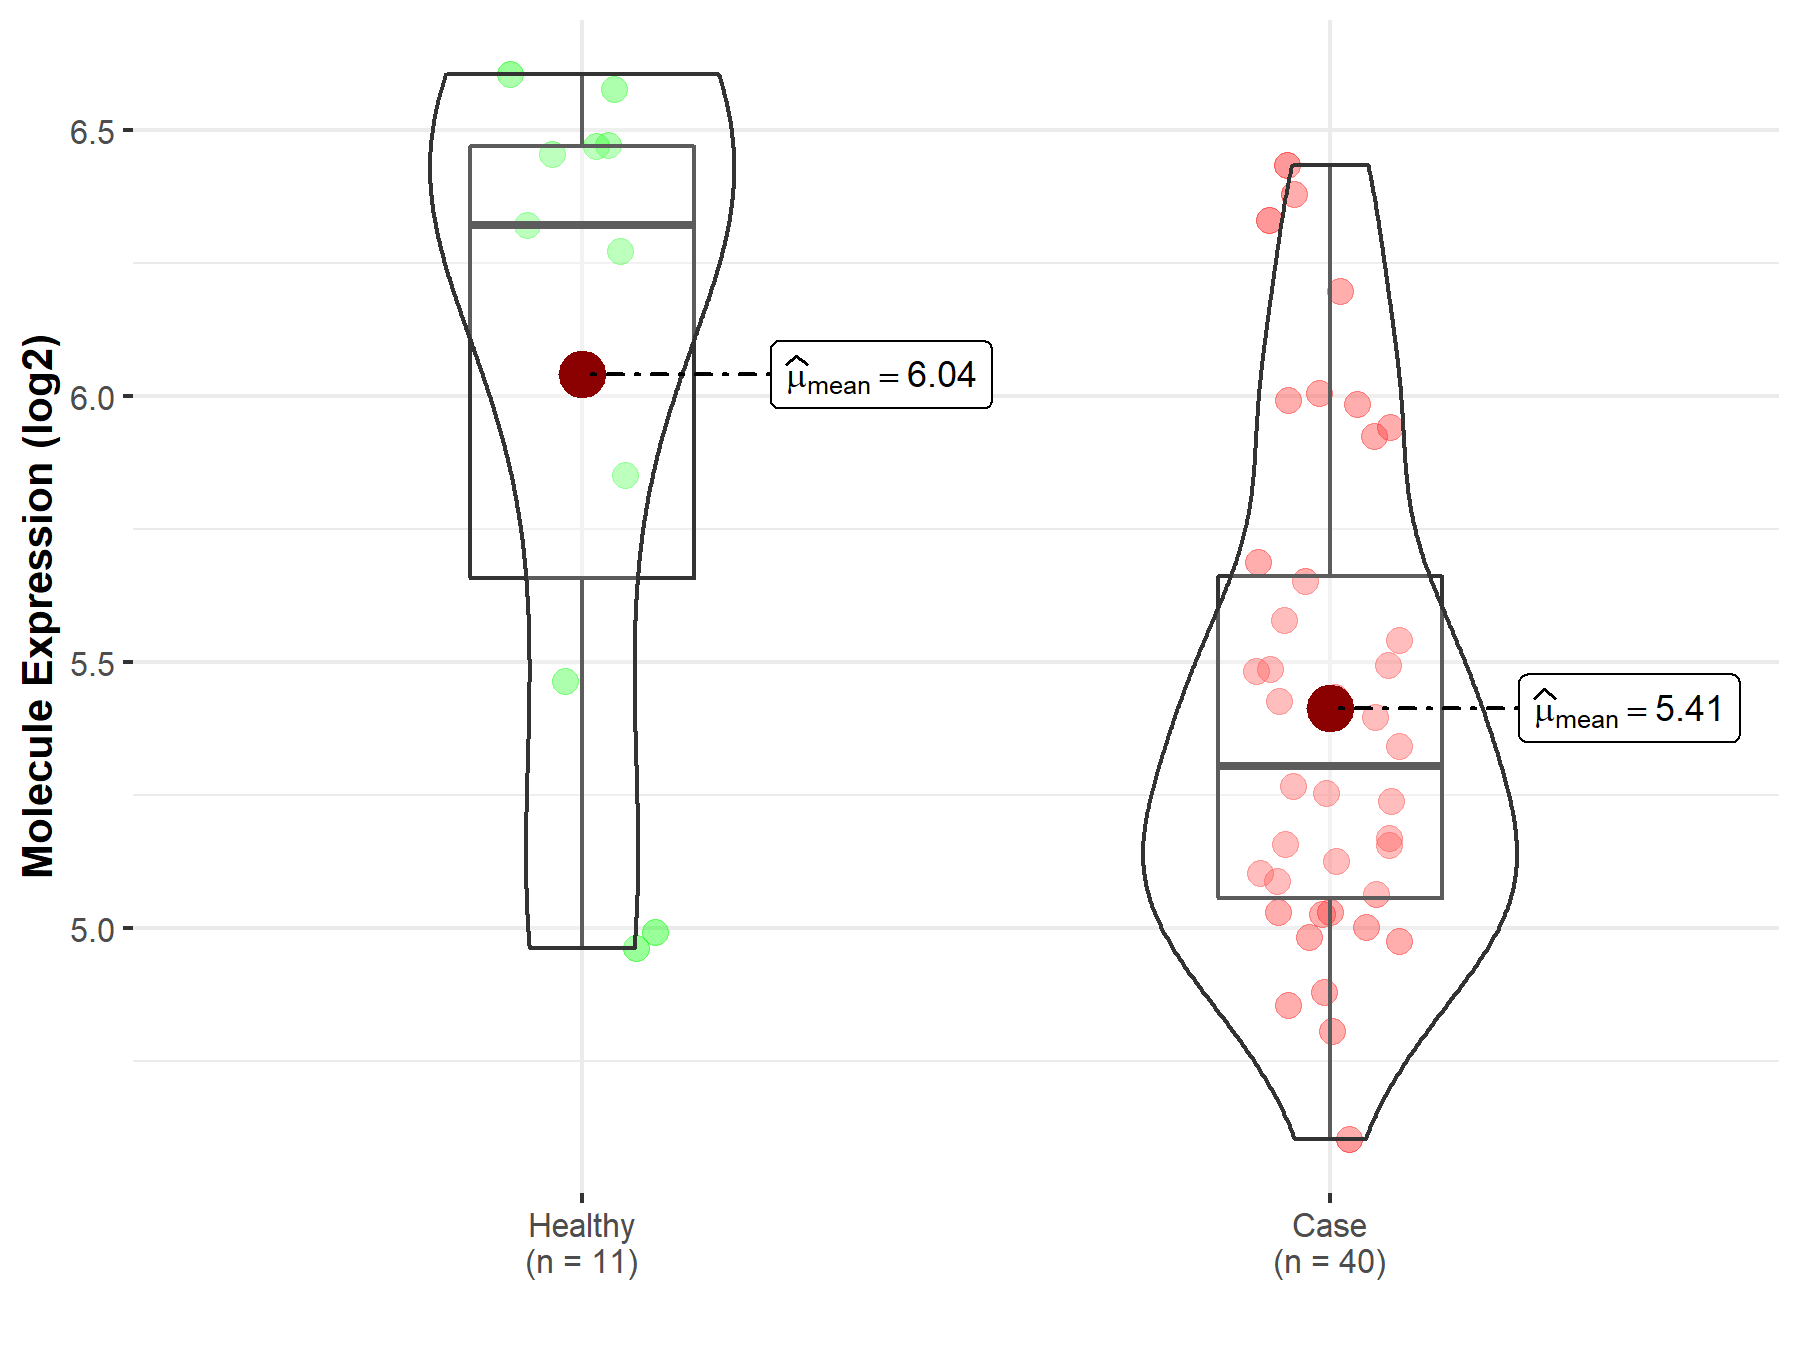
| The Studied Tissue | Brainstem tissue | |
| The Specified Disease | Glioma | |
| The Expression Level of Disease Section Compare with the Healthy Individual Tissue | p-value: 8.40E-01; Fold-change: -1.95E-01; Z-score: -4.45E-01 | |
|
Molecule expression in the diseased tissue of patients
Molecule expression in the normal tissue of healthy individuals
|
||
| Disease-specific Molecule Abundances |

|
Click to View the Clearer Original Diagram |
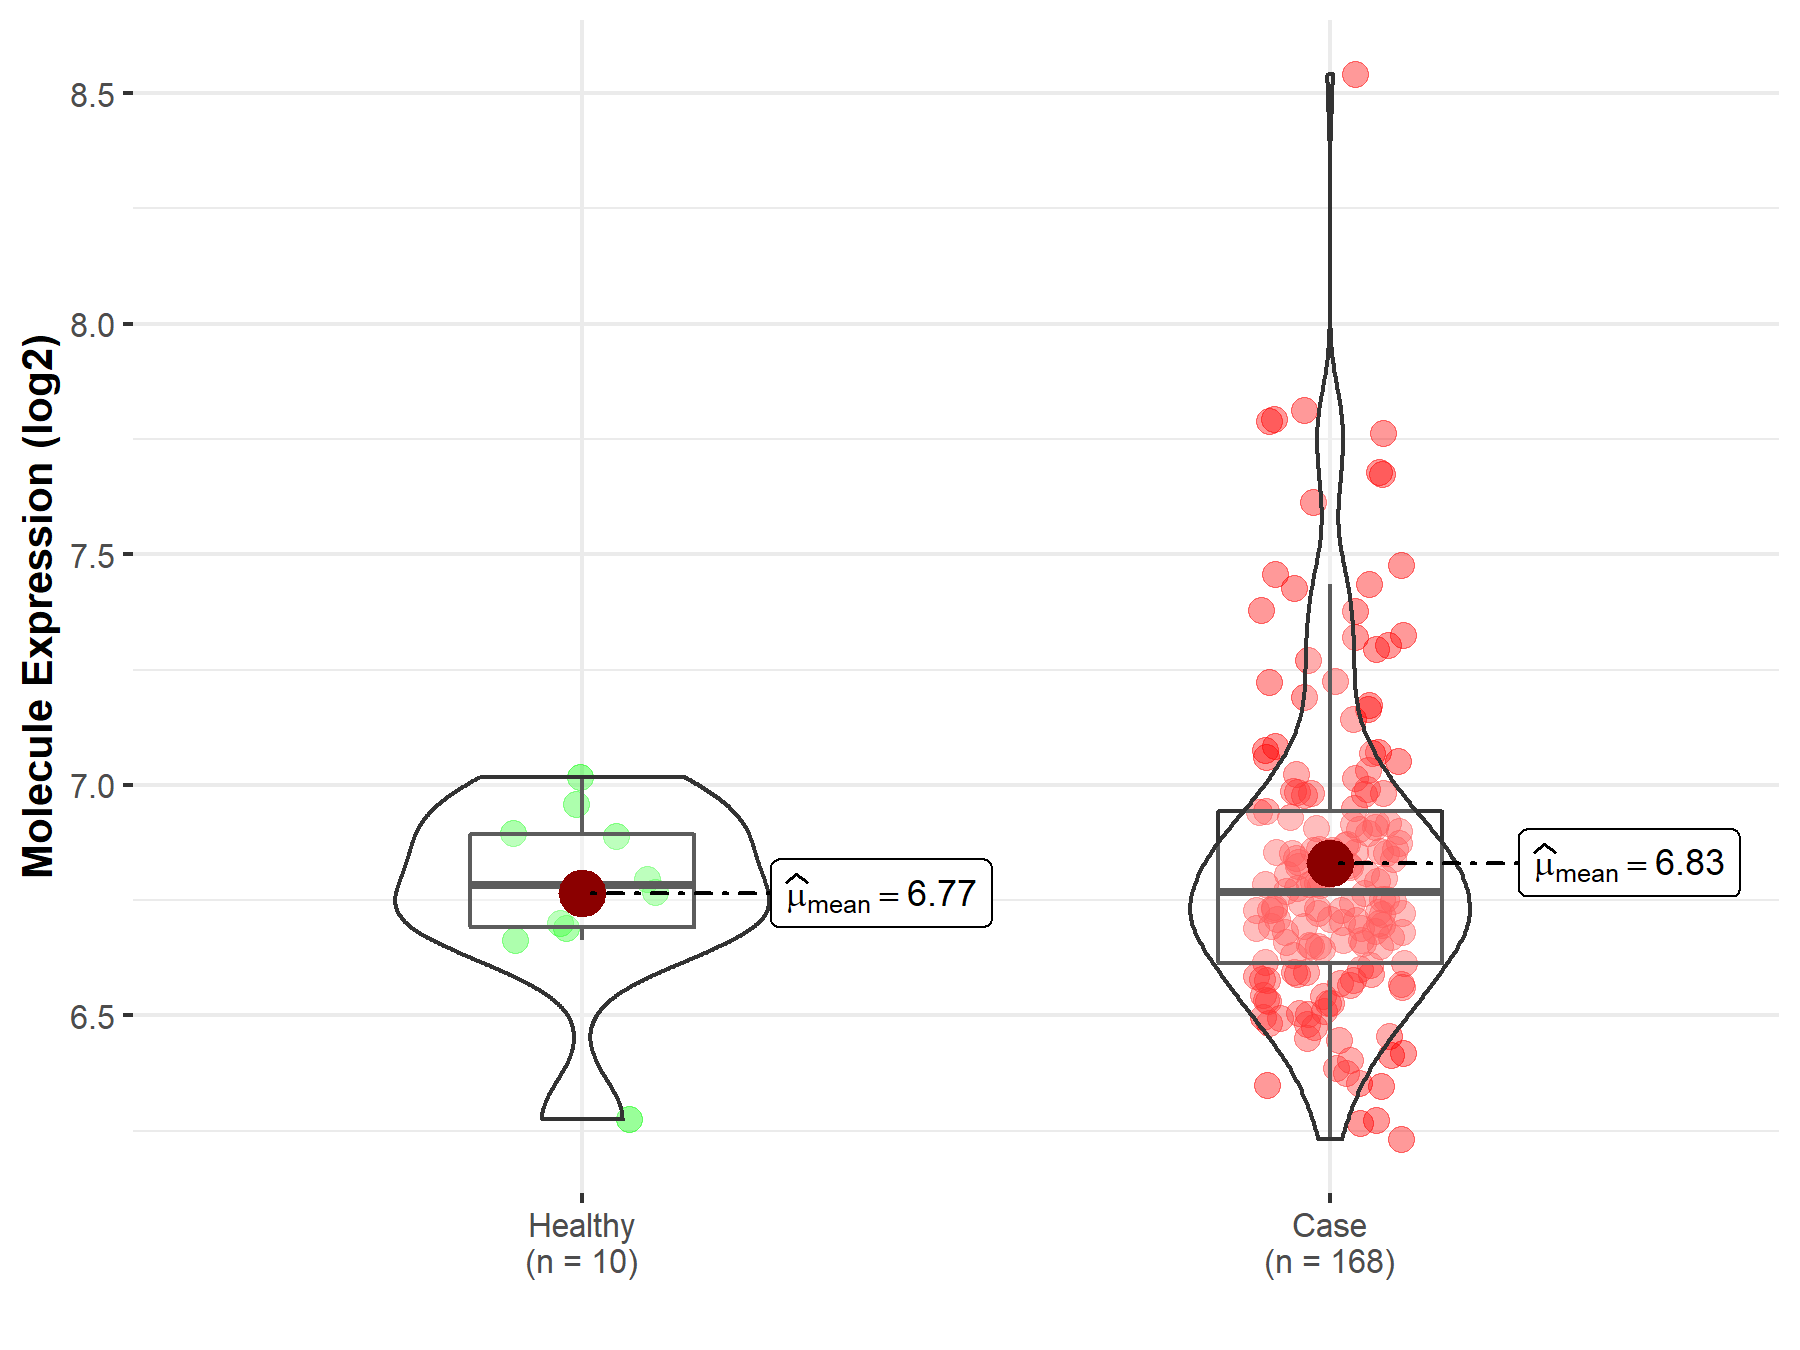
| The Studied Tissue | White matter | |
| The Specified Disease | Glioma | |
| The Expression Level of Disease Section Compare with the Healthy Individual Tissue | p-value: 8.35E-03; Fold-change: -1.02E+00; Z-score: -1.63E+00 | |
|
Molecule expression in the diseased tissue of patients
Molecule expression in the normal tissue of healthy individuals
|
||
| Disease-specific Molecule Abundances |
|
Click to View the Clearer Original Diagram |
| The Studied Tissue | Brainstem tissue | |
| The Specified Disease | Neuroectodermal tumor | |
| The Expression Level of Disease Section Compare with the Healthy Individual Tissue | p-value: 3.75E-01; Fold-change: -1.40E-02; Z-score: -6.69E-02 | |
|
Molecule expression in the diseased tissue of patients
Molecule expression in the normal tissue of healthy individuals
|
||
| Disease-specific Molecule Abundances |
|
Click to View the Clearer Original Diagram |
| Differential expression of molecule in resistant diseases | ||
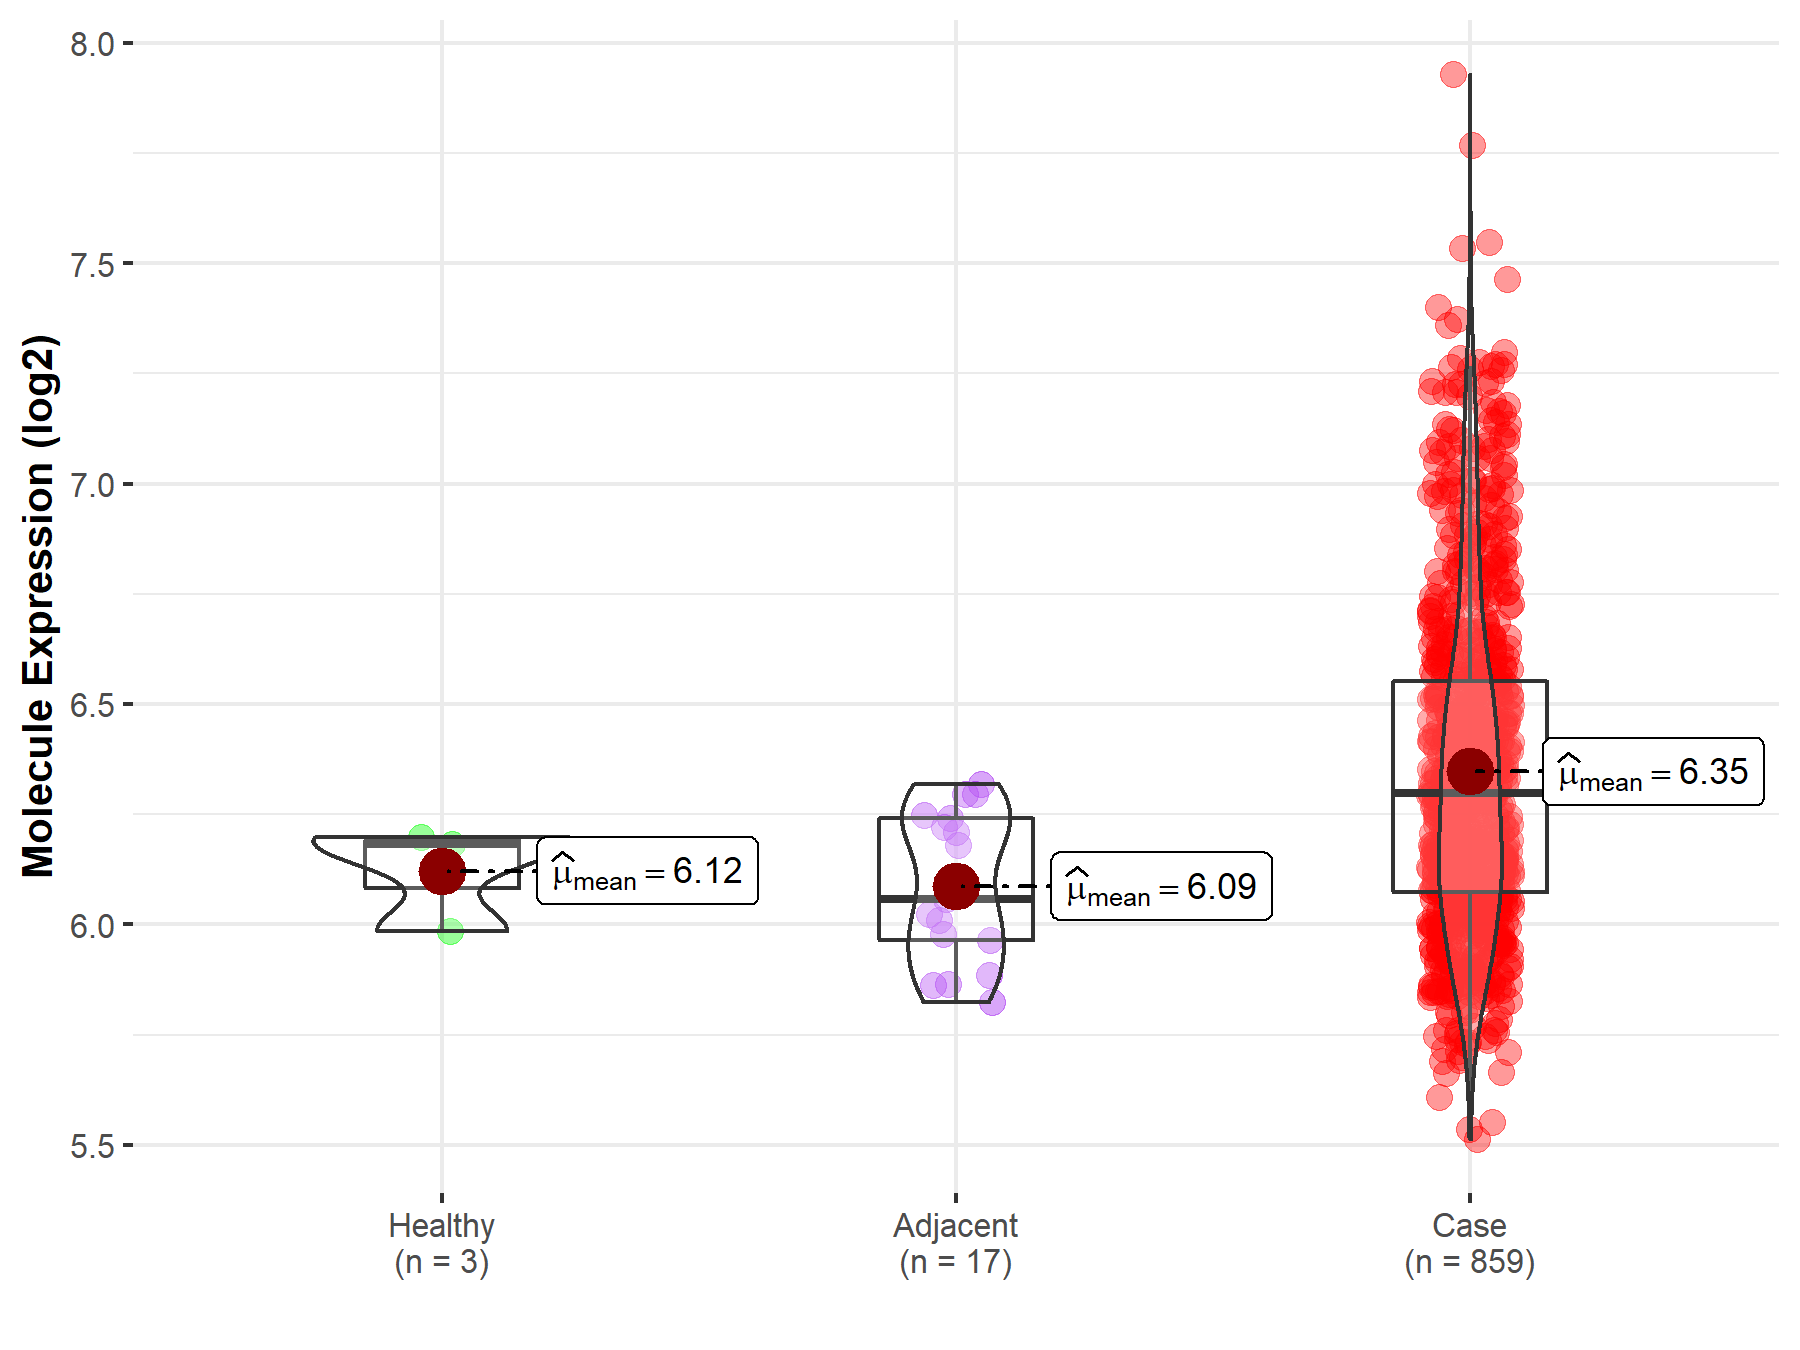
| The Studied Tissue | Gastric tissue | |
| The Specified Disease | Gastric cancer | |
| The Expression Level of Disease Section Compare with the Healthy Individual Tissue | p-value: 7.70E-02; Fold-change: 1.16E-01; Z-score: 9.73E-01 | |
| The Expression Level of Disease Section Compare with the Adjacent Tissue | p-value: 1.04E-05; Fold-change: 2.41E-01; Z-score: 1.39E+00 | |
|
Molecule expression in the normal tissue adjacent to the diseased tissue of patients
Molecule expression in the diseased tissue of patients
Molecule expression in the normal tissue of healthy individuals
|
||
| Disease-specific Molecule Abundances |
|
Click to View the Clearer Original Diagram |
| Differential expression of molecule in resistant diseases | ||
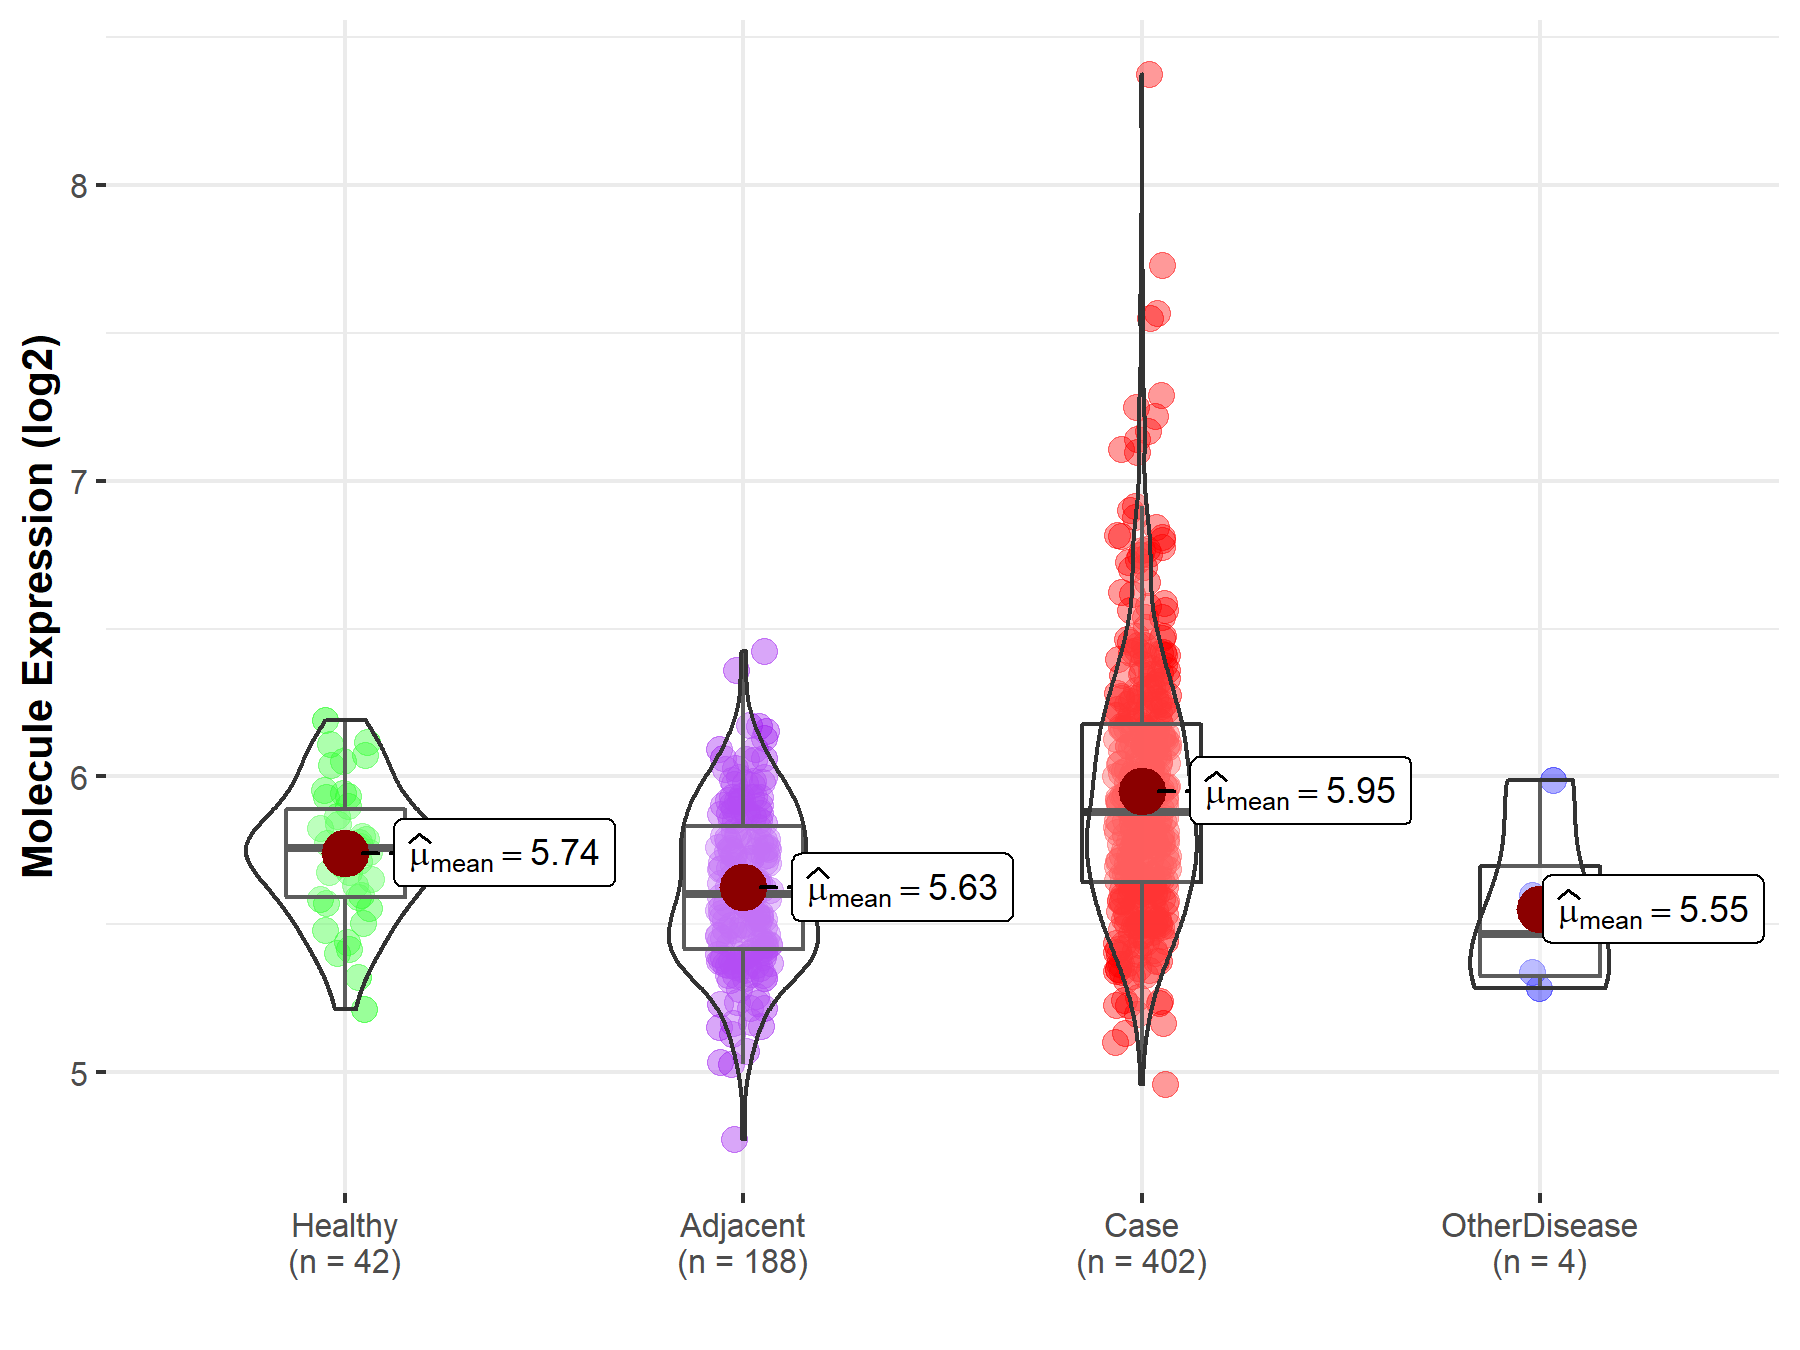
| The Studied Tissue | Liver | |
| The Specified Disease | Liver cancer | |
| The Expression Level of Disease Section Compare with the Healthy Individual Tissue | p-value: 2.24E-06; Fold-change: 1.23E-01; Z-score: 5.52E-01 | |
| The Expression Level of Disease Section Compare with the Adjacent Tissue | p-value: 4.21E-25; Fold-change: 2.79E-01; Z-score: 1.02E+00 | |
| The Expression Level of Disease Section Compare with the Other Disease Section | p-value: 8.77E-02; Fold-change: 4.13E-01; Z-score: 1.28E+00 | |
|
Molecule expression in the normal tissue adjacent to the diseased tissue of patients
Molecule expression in the diseased tissue of patients
Molecule expression in the normal tissue of healthy individuals
Molecule expression in tissue other than the diseased tissue of patients
|
||
| Disease-specific Molecule Abundances |
|
Click to View the Clearer Original Diagram |
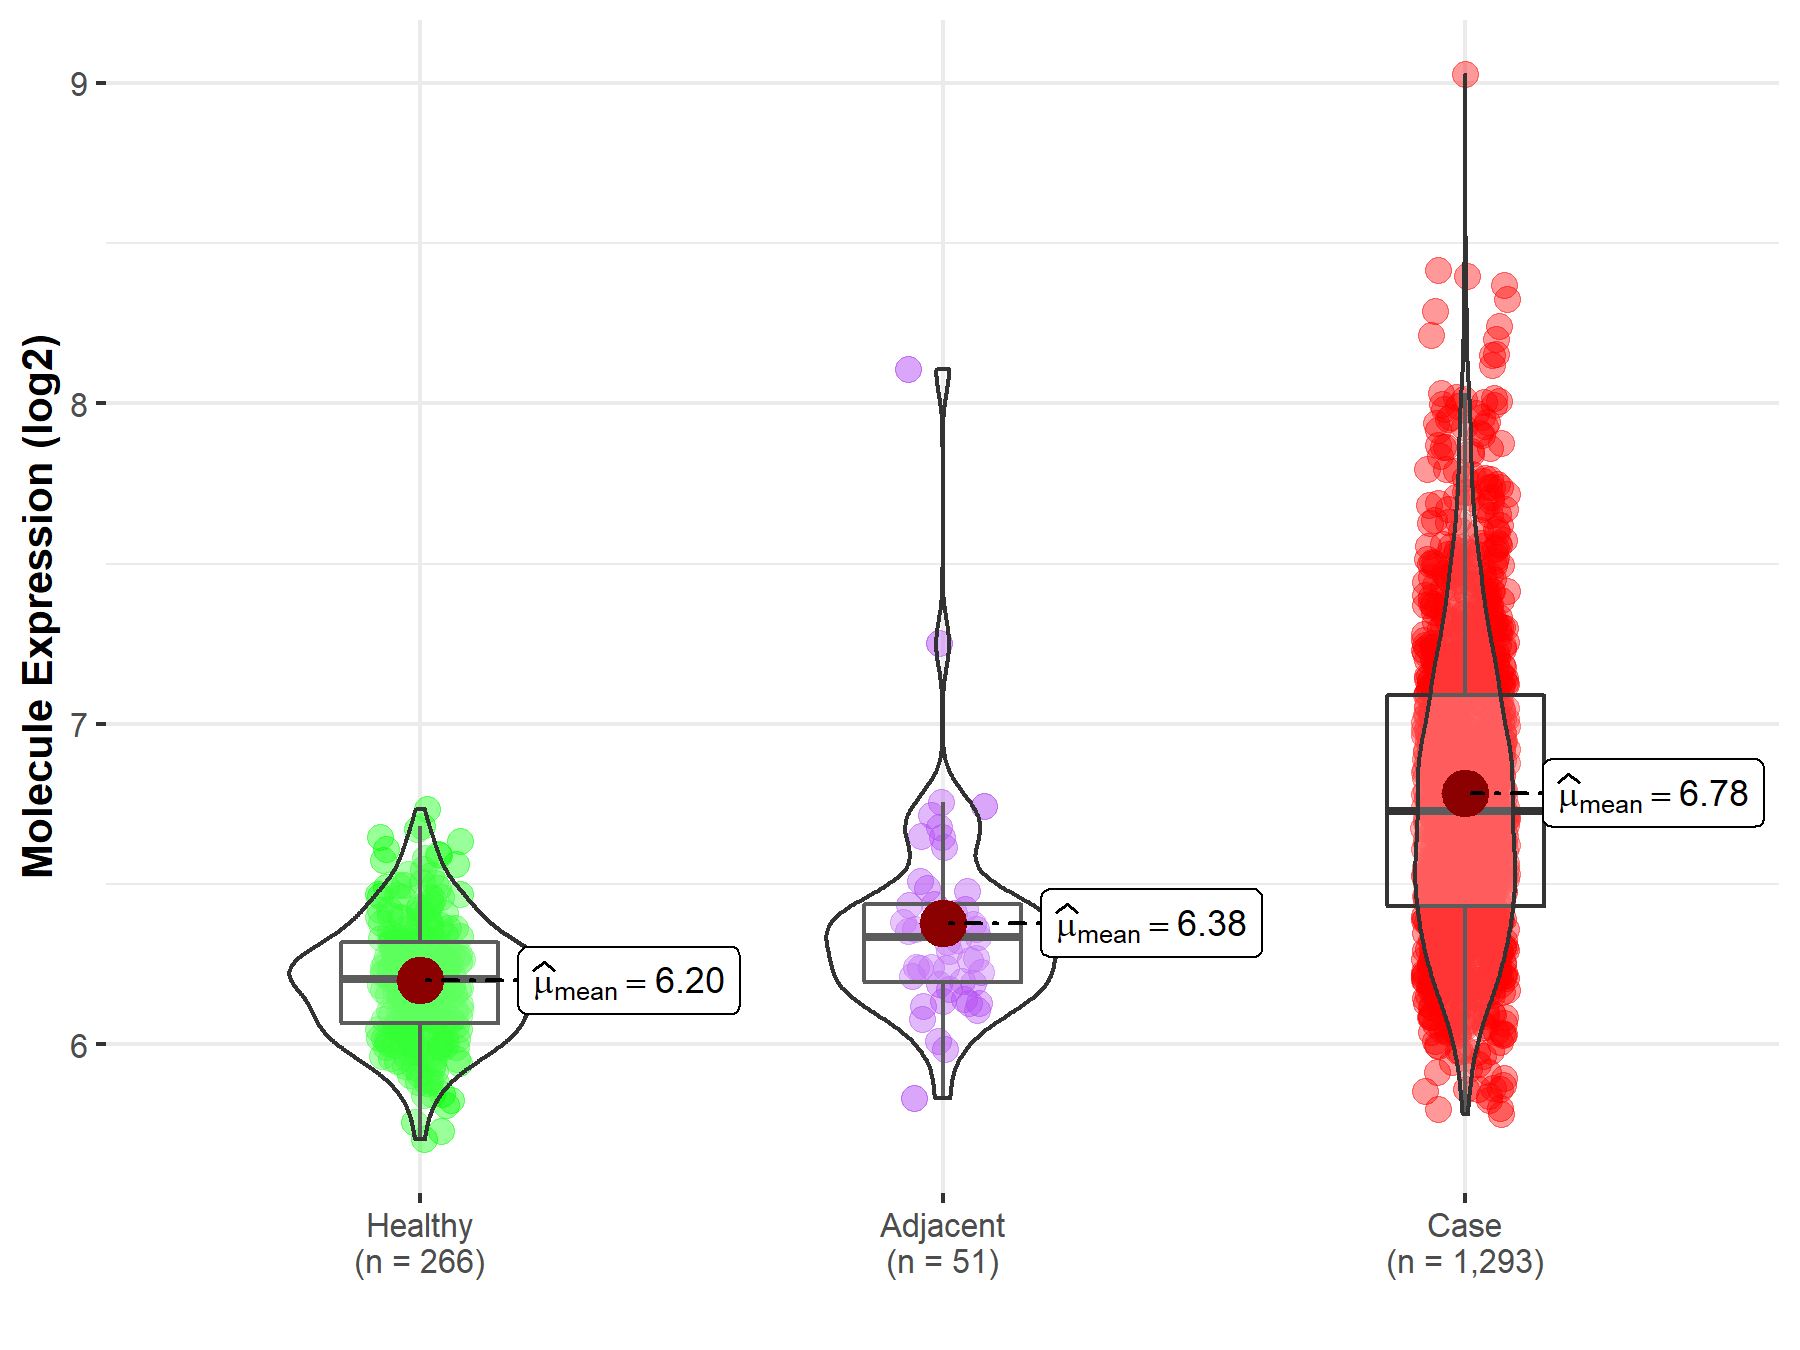
| Differential expression of molecule in resistant diseases | ||
| The Studied Tissue | Breast tissue | |
| The Specified Disease | Breast cancer | |
| The Expression Level of Disease Section Compare with the Healthy Individual Tissue | p-value: 3.31E-167; Fold-change: 5.27E-01; Z-score: 2.81E+00 | |
| The Expression Level of Disease Section Compare with the Adjacent Tissue | p-value: 3.30E-11; Fold-change: 3.94E-01; Z-score: 1.15E+00 | |
|
Molecule expression in the normal tissue adjacent to the diseased tissue of patients
Molecule expression in the diseased tissue of patients
Molecule expression in the normal tissue of healthy individuals
|
||
| Disease-specific Molecule Abundances |
|
Click to View the Clearer Original Diagram |
Tissue-specific Molecule Abundances in Healthy Individuals


|
||
References
If you find any error in data or bug in web service, please kindly report it to Dr. Sun and Dr. Yu.