Molecule Information
General Information of the Molecule (ID: Mol00275)
| Name |
CCN family member 1 (CYR61)
,Homo sapiens
|
||||
|---|---|---|---|---|---|
| Synonyms |
Cellular communication network factor 1; Cysteine-rich angiogenic inducer 61; Insulin-like growth factor-binding protein 10; IBP-10; IGF-binding protein 10; IGFBP-10; Protein CYR61; Protein GIG1; CYR61; GIG1; IGFBP10
Click to Show/Hide
|
||||
| Molecule Type |
Protein
|
||||
| Gene Name |
CCN1
|
||||
| Gene ID | |||||
| Location |
chr1:85580761-85584589[+]
|
||||
| Sequence |
MSSRIARALALVVTLLHLTRLALSTCPAACHCPLEAPKCAPGVGLVRDGCGCCKVCAKQL
NEDCSKTQPCDHTKGLECNFGASSTALKGICRAQSEGRPCEYNSRIYQNGESFQPNCKHQ CTCIDGAVGCIPLCPQELSLPNLGCPNPRLVKVTGQCCEEWVCDEDSIKDPMEDQDGLLG KELGFDASEVELTRNNELIAVGKGSSLKRLPVFGMEPRILYNPLQGQKCIVQTTSWSQCS KTCGTGISTRVTNDNPECRLVKETRICEVRPCGQPVYSSLKKGKKCSKTKKSPEPVRFTY AGCLSVKKYRPKYCGSCVDGRCCTPQLTRTVKMRFRCEDGETFSKNVMMIQSCKCNYNCP HANEAAFPFYRLFNDIHKFRD Click to Show/Hide
|
||||
| Function |
Promotes cell proliferation, chemotaxis, angiogenesis and cell adhesion. Appears to play a role in wound healing by up-regulating, in skin fibroblasts, the expression of a number of genes involved in angiogenesis, inflammation and matrix remodeling including VEGA-A, VEGA-C, MMP1, MMP3, TIMP1, uPA, PAI-1 and integrins alpha-3 and alpha-5. CCN1-mediated gene regulation is dependent on heparin-binding. Down-regulates the expression of alpha-1 and alpha-2 subunits of collagen type-1. Promotes cell adhesion and adhesive signaling through integrin alpha-6/beta-1, cell migration through integrin alpha-v/beta-5 and cell proliferation through integrin alpha-v/beta-3.
Click to Show/Hide
|
||||
| Uniprot ID | |||||
| Ensembl ID | |||||
| HGNC ID | |||||
| Click to Show/Hide the Complete Species Lineage | |||||
Type(s) of Resistant Mechanism of This Molecule
Drug Resistance Data Categorized by Drug
Approved Drug(s)
1 drug(s) in total
| Drug Resistance Data Categorized by Their Corresponding Mechanisms | ||||
|
|
||||
| Disease Class: Glioma [ICD-11: 2A00.1] | [1] | |||
| Resistant Disease | Glioma [ICD-11: 2A00.1] | |||
| Resistant Drug | Temozolomide | |||
| Molecule Alteration | Expression | Up-regulation |
||
| Differential expression of the molecule in resistant disease | ||||
| Classification of Disease | Brain cancer [ICD-11: 2A00] | |||
| The Specified Disease | Brain cancer | |||
| The Studied Tissue | Nervous tissue | |||
| The Expression Level of Disease Section Compare with the Healthy Individual Tissue | p-value: 9.55E-58 Fold-change: 2.09E-01 Z-score: 1.72E+01 |
|||
| Experimental Note | Revealed Based on the Cell Line Data | |||
| Cell Pathway Regulation | Cell apoptosis | Inhibition | hsa04210 | |
| Cell colony | Activation | hsa05200 | ||
| Cell viability | Activation | hsa05200 | ||
| RAF/ERK signaling pathway | Activation | hsa04010 | ||
| In Vitro Model | U251 cells | Brain | Homo sapiens (Human) | CVCL_0021 |
| U87 cells | Brain | Homo sapiens (Human) | CVCL_0022 | |
| Experiment for Molecule Alteration |
Western blot analysis | |||
| Experiment for Drug Resistance |
CCK8 assay; Flow cytometry assay | |||
| Mechanism Description | Overexpression of CYR61 increased the survival rate of U251/TMZ and U87/TMZ cells after TMZ treatment, while induction of miR-634 significantly suppressed the survival of U251/TMZ and U87/TMZ cells after TMZ treatment. | |||
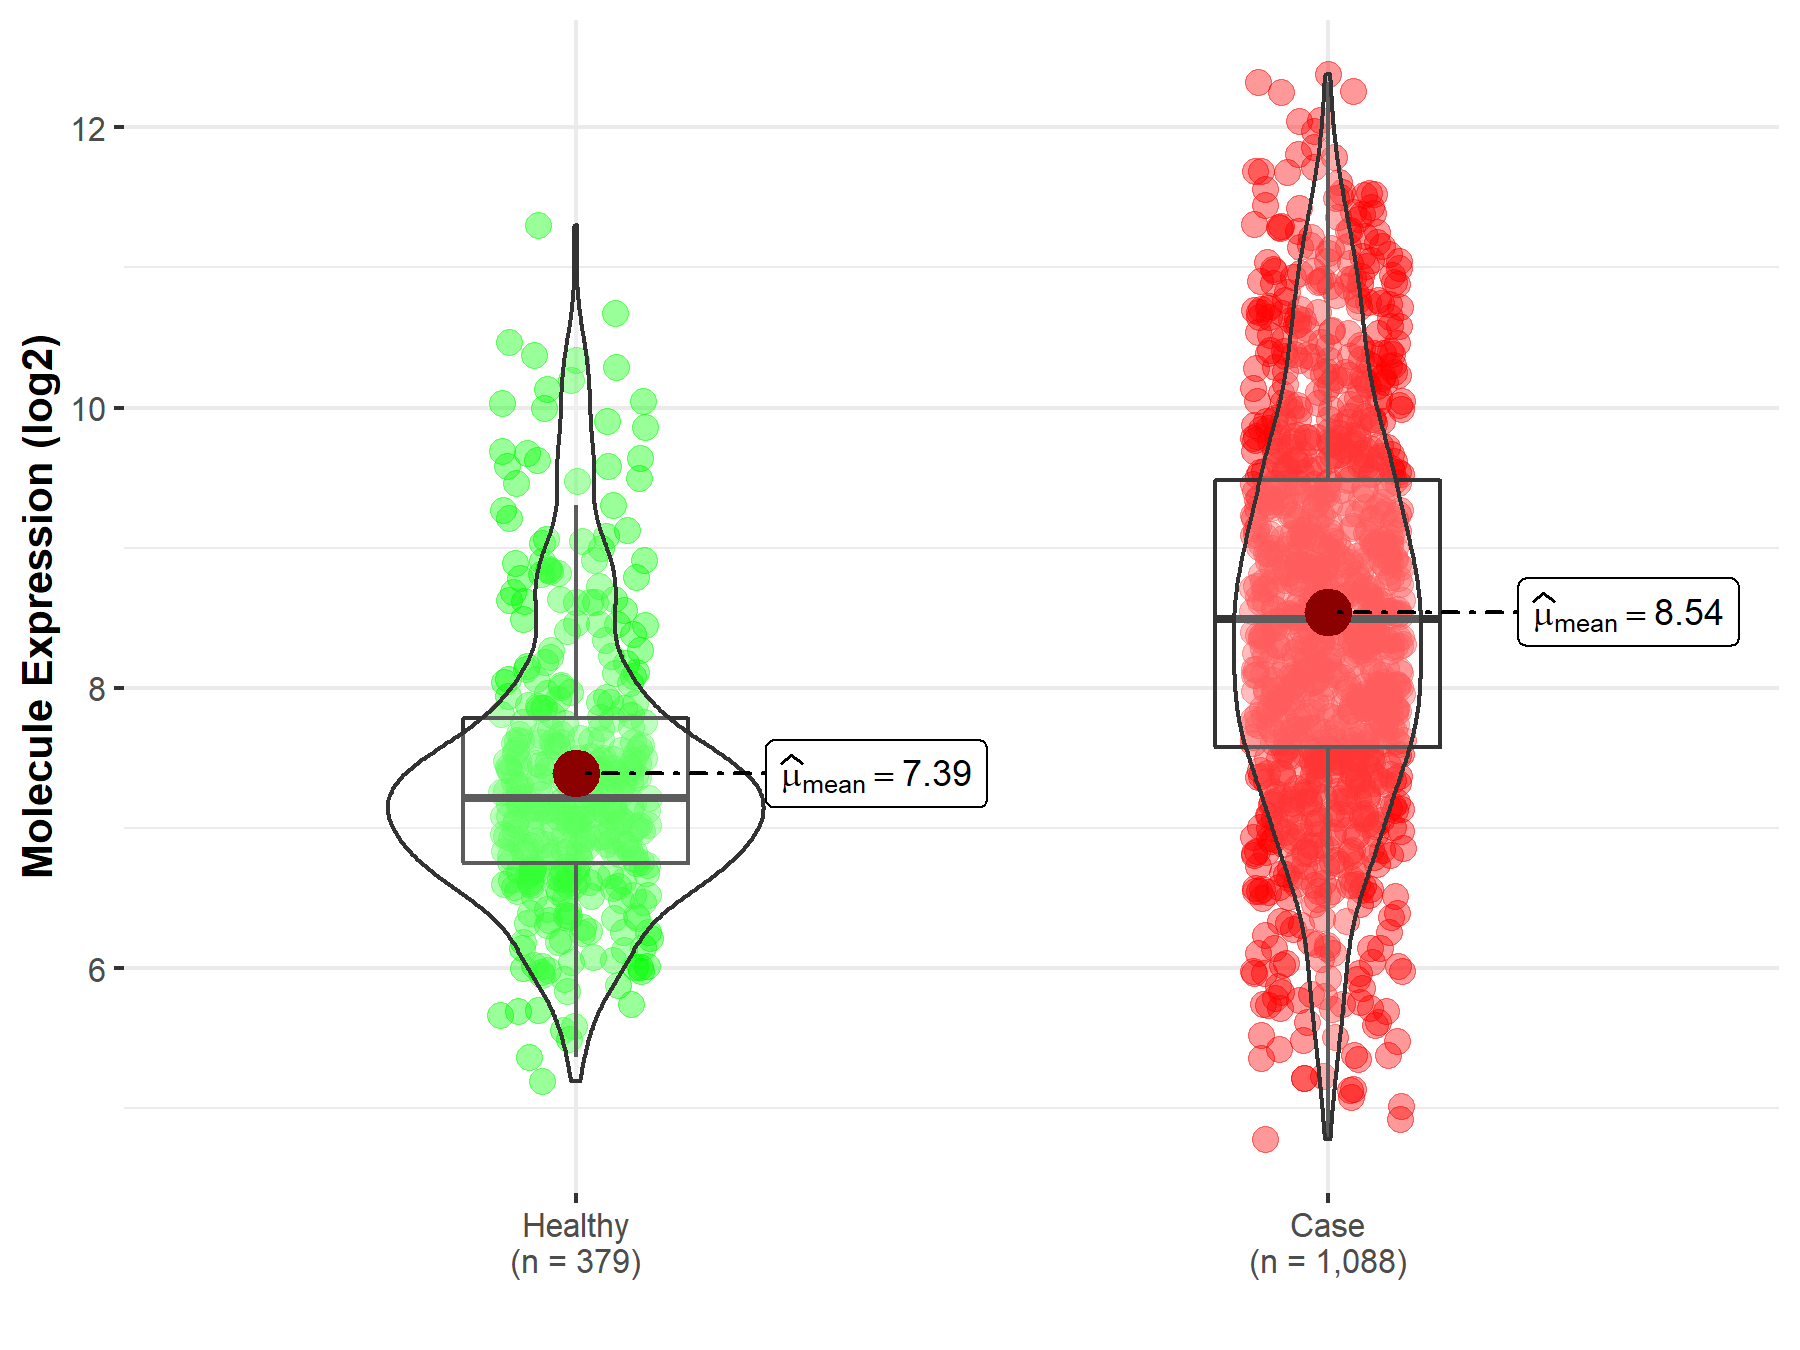
Disease- and Tissue-specific Abundances of This Molecule
ICD Disease Classification 02

| Differential expression of molecule in resistant diseases | ||
| The Studied Tissue | Nervous tissue | |
| The Specified Disease | Brain cancer | |
| The Expression Level of Disease Section Compare with the Healthy Individual Tissue | p-value: 9.55E-58; Fold-change: 1.27E+00; Z-score: 1.27E+00 | |
|
Molecule expression in the diseased tissue of patients
Molecule expression in the normal tissue of healthy individuals
|
||
| Disease-specific Molecule Abundances |

|
Click to View the Clearer Original Diagram |
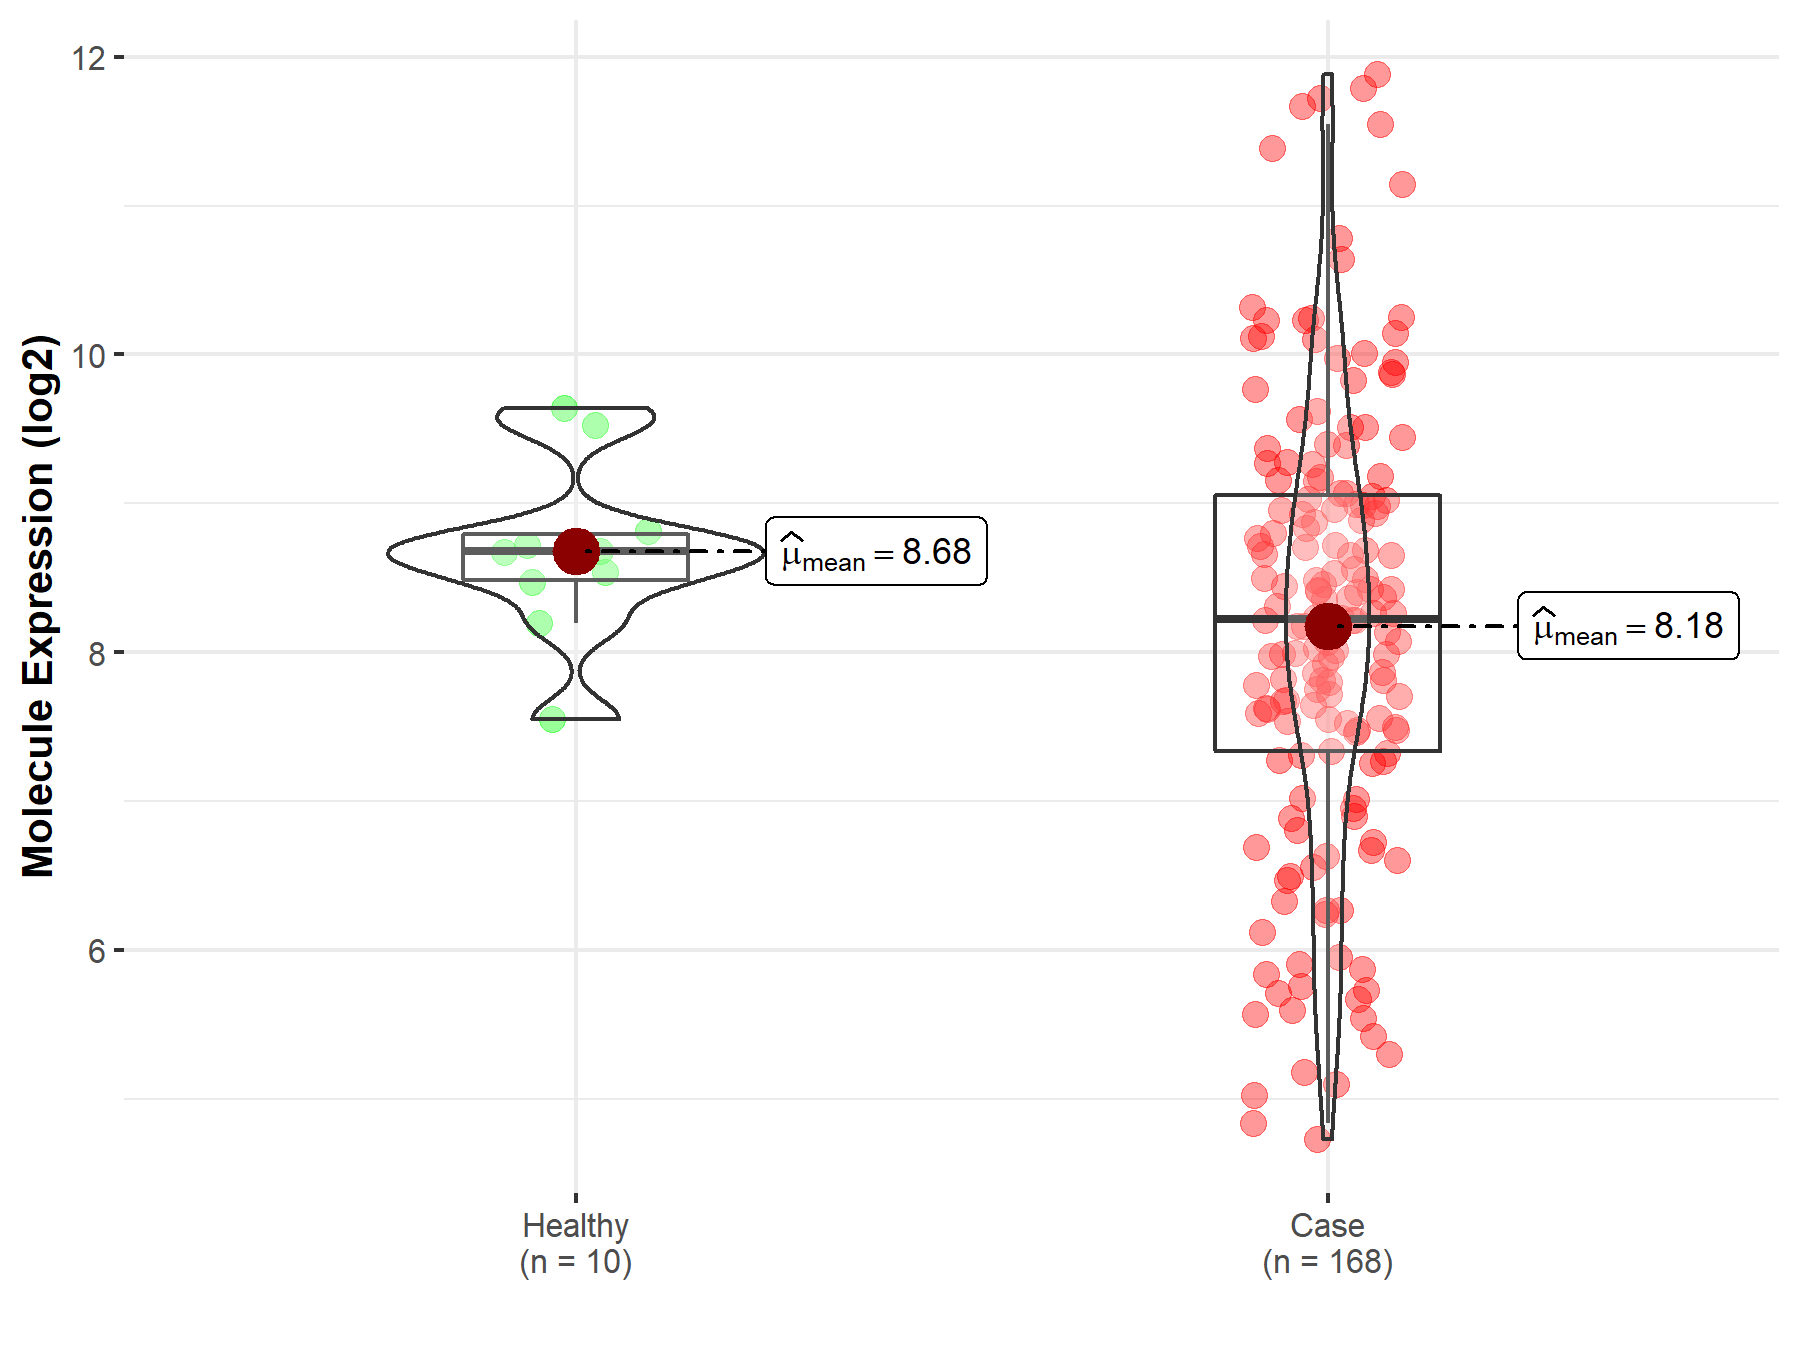
| The Studied Tissue | Brainstem tissue | |
| The Specified Disease | Glioma | |
| The Expression Level of Disease Section Compare with the Healthy Individual Tissue | p-value: 3.90E-01; Fold-change: -4.94E-02; Z-score: -2.97E-01 | |
|
Molecule expression in the diseased tissue of patients
Molecule expression in the normal tissue of healthy individuals
|
||
| Disease-specific Molecule Abundances |

|
Click to View the Clearer Original Diagram |
| The Studied Tissue | White matter | |
| The Specified Disease | Glioma | |
| The Expression Level of Disease Section Compare with the Healthy Individual Tissue | p-value: 1.35E-02; Fold-change: 6.54E-01; Z-score: 8.14E-01 | |
|
Molecule expression in the diseased tissue of patients
Molecule expression in the normal tissue of healthy individuals
|
||
| Disease-specific Molecule Abundances |

|
Click to View the Clearer Original Diagram |
| The Studied Tissue | Brainstem tissue | |
| The Specified Disease | Neuroectodermal tumor | |
| The Expression Level of Disease Section Compare with the Healthy Individual Tissue | p-value: 3.74E-02; Fold-change: -4.54E-01; Z-score: -7.58E-01 | |
|
Molecule expression in the diseased tissue of patients
Molecule expression in the normal tissue of healthy individuals
|
||
| Disease-specific Molecule Abundances |

|
Click to View the Clearer Original Diagram |
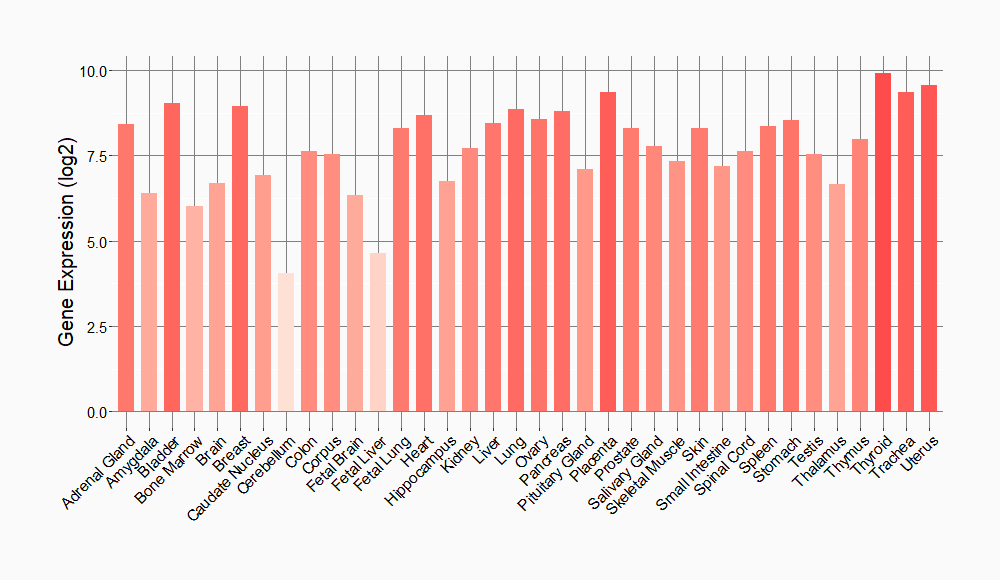
Tissue-specific Molecule Abundances in Healthy Individuals


|
||
References
If you find any error in data or bug in web service, please kindly report it to Dr. Sun and Dr. Yu.
