Molecule Information
General Information of the Molecule (ID: Mol00259)
| Name |
Bromodomain-containing protein 4 (BRD4)
,Homo sapiens
|
||||
|---|---|---|---|---|---|
| Synonyms |
Protein HUNK1; HUNK1
Click to Show/Hide
|
||||
| Molecule Type |
Protein
|
||||
| Gene Name |
BRD4
|
||||
| Gene ID | |||||
| Location |
chr19:15235519-15332545[-]
|
||||
| Sequence |
MSAESGPGTRLRNLPVMGDGLETSQMSTTQAQAQPQPANAASTNPPPPETSNPNKPKRQT
NQLQYLLRVVLKTLWKHQFAWPFQQPVDAVKLNLPDYYKIIKTPMDMGTIKKRLENNYYW NAQECIQDFNTMFTNCYIYNKPGDDIVLMAEALEKLFLQKINELPTEETEIMIVQAKGRG RGRKETGTAKPGVSTVPNTTQASTPPQTQTPQPNPPPVQATPHPFPAVTPDLIVQTPVMT VVPPQPLQTPPPVPPQPQPPPAPAPQPVQSHPPIIAATPQPVKTKKGVKRKADTTTPTTI DPIHEPPSLPPEPKTTKLGQRRESSRPVKPPKKDVPDSQQHPAPEKSSKVSEQLKCCSGI LKEMFAKKHAAYAWPFYKPVDVEALGLHDYCDIIKHPMDMSTIKSKLEAREYRDAQEFGA DVRLMFSNCYKYNPPDHEVVAMARKLQDVFEMRFAKMPDEPEEPVVAVSSPAVPPPTKVV APPSSSDSSSDSSSDSDSSTDDSEEERAQRLAELQEQLKAVHEQLAALSQPQQNKPKKKE KDKKEKKKEKHKRKEEVEENKKSKAKEPPPKKTKKNNSSNSNVSKKEPAPMKSKPPPTYE SEEEDKCKPMSYEEKRQLSLDINKLPGEKLGRVVHIIQSREPSLKNSNPDEIEIDFETLK PSTLRELERYVTSCLRKKRKPQAEKVDVIAGSSKMKGFSSSESESSSESSSSDSEDSETE MAPKSKKKGHPGREQKKHHHHHHQQMQQAPAPVPQQPPPPPQQPPPPPPPQQQQQPPPPP PPPSMPQQAAPAMKSSPPPFIATQVPVLEPQLPGSVFDPIGHFTQPILHLPQPELPPHLP QPPEHSTPPHLNQHAVVSPPALHNALPQQPSRPSNRAAALPPKPARPPAVSPALTQTPLL PQPPMAQPPQVLLEDEEPPAPPLTSMQMQLYLQQLQKVQPPTPLLPSVKVQSQPPPPLPP PPHPSVQQQLQQQPPPPPPPQPQPPPQQQHQPPPRPVHLQPMQFSTHIQQPPPPQGQQPP HPPPGQQPPPPQPAKPQQVIQHHHSPRHHKSDPYSTGHLREAPSPLMIHSPQMSQFQSLT HQSPPQQNVQPKKQELRAASVVQPQPLVVVKEEKIHSPIIRSEPFSPSLRPEPPKHPESI KAPVHLPQRPEMKPVDVGRPVIRPPEQNAPPPGAPDKDKQKQEPKTPVAPKKDLKIKNMG SWASLVQKHPTTPSSTAKSSSDSFEQFRRAAREKEEREKALKAQAEHAEKEKERLRQERM RSREDEDALEQARRAHEEARRRQEQQQQQRQEQQQQQQQQAAAVAAAATPQAQSSQPQSM LDQQRELARKREQERRRREAMAATIDMNFQSDLLSIFEENLF Click to Show/Hide
|
||||
| 3D-structure |
|
||||
| Function |
Chromatin reader protein that recognizes and binds acetylated histones and plays a key role in transmission of epigenetic memory across cell divisions and transcription regulation. Remains associated with acetylated chromatin throughout the entire cell cycle and provides epigenetic memory for postmitotic G1 gene transcription by preserving acetylated chromatin status and maintaining high-order chromatin structure. During interphase, plays a key role in regulating the transcription of signal-inducible genes by associating with the P-TEFb complex and recruiting it to promoters. Also recruits P-TEFb complex to distal enhancers, so called anti-pause enhancers in collaboration with JMJD6. BRD4 and JMJD6 are required to form the transcriptionally active P-TEFb complex by displacing negative regulators such as HEXIM1 and 7SKsnRNA complex from P-TEFb, thereby transforming it into an active form that can then phosphorylate the C-terminal domain (CTD) of RNA polymerase II. Promotes phosphorylation of 'Ser-2' of the C-terminal domain (CTD) of RNA polymerase II. According to a report, directly acts as an atypical protein kinase and mediates phosphorylation of 'Ser-2' of the C-terminal domain (CTD) of RNA polymerase II; these data however need additional evidences in vivo. In addition to acetylated histones, also recognizes and binds acetylated RELA, leading to further recruitment of the P-TEFb complex and subsequent activation of NF-kappa-B. Also acts as a regulator of p53/TP53-mediated transcription: following phosphorylation by CK2, recruited to p53/TP53 specific target promoters.
Click to Show/Hide
|
||||
| Uniprot ID | |||||
| Ensembl ID | |||||
| HGNC ID | |||||
| Click to Show/Hide the Complete Species Lineage | |||||
Type(s) of Resistant Mechanism of This Molecule
Drug Resistance Data Categorized by Drug
Approved Drug(s)
1 drug(s) in total
| Drug Resistance Data Categorized by Their Corresponding Mechanisms | ||||
|
|
||||
| Disease Class: Pancreatic cancer [ICD-11: 2C10.3] | [1] | |||
| Resistant Disease | Pancreatic cancer [ICD-11: 2C10.3] | |||
| Resistant Drug | Gemcitabine | |||
| Molecule Alteration | Expression | Up-regulation |
||
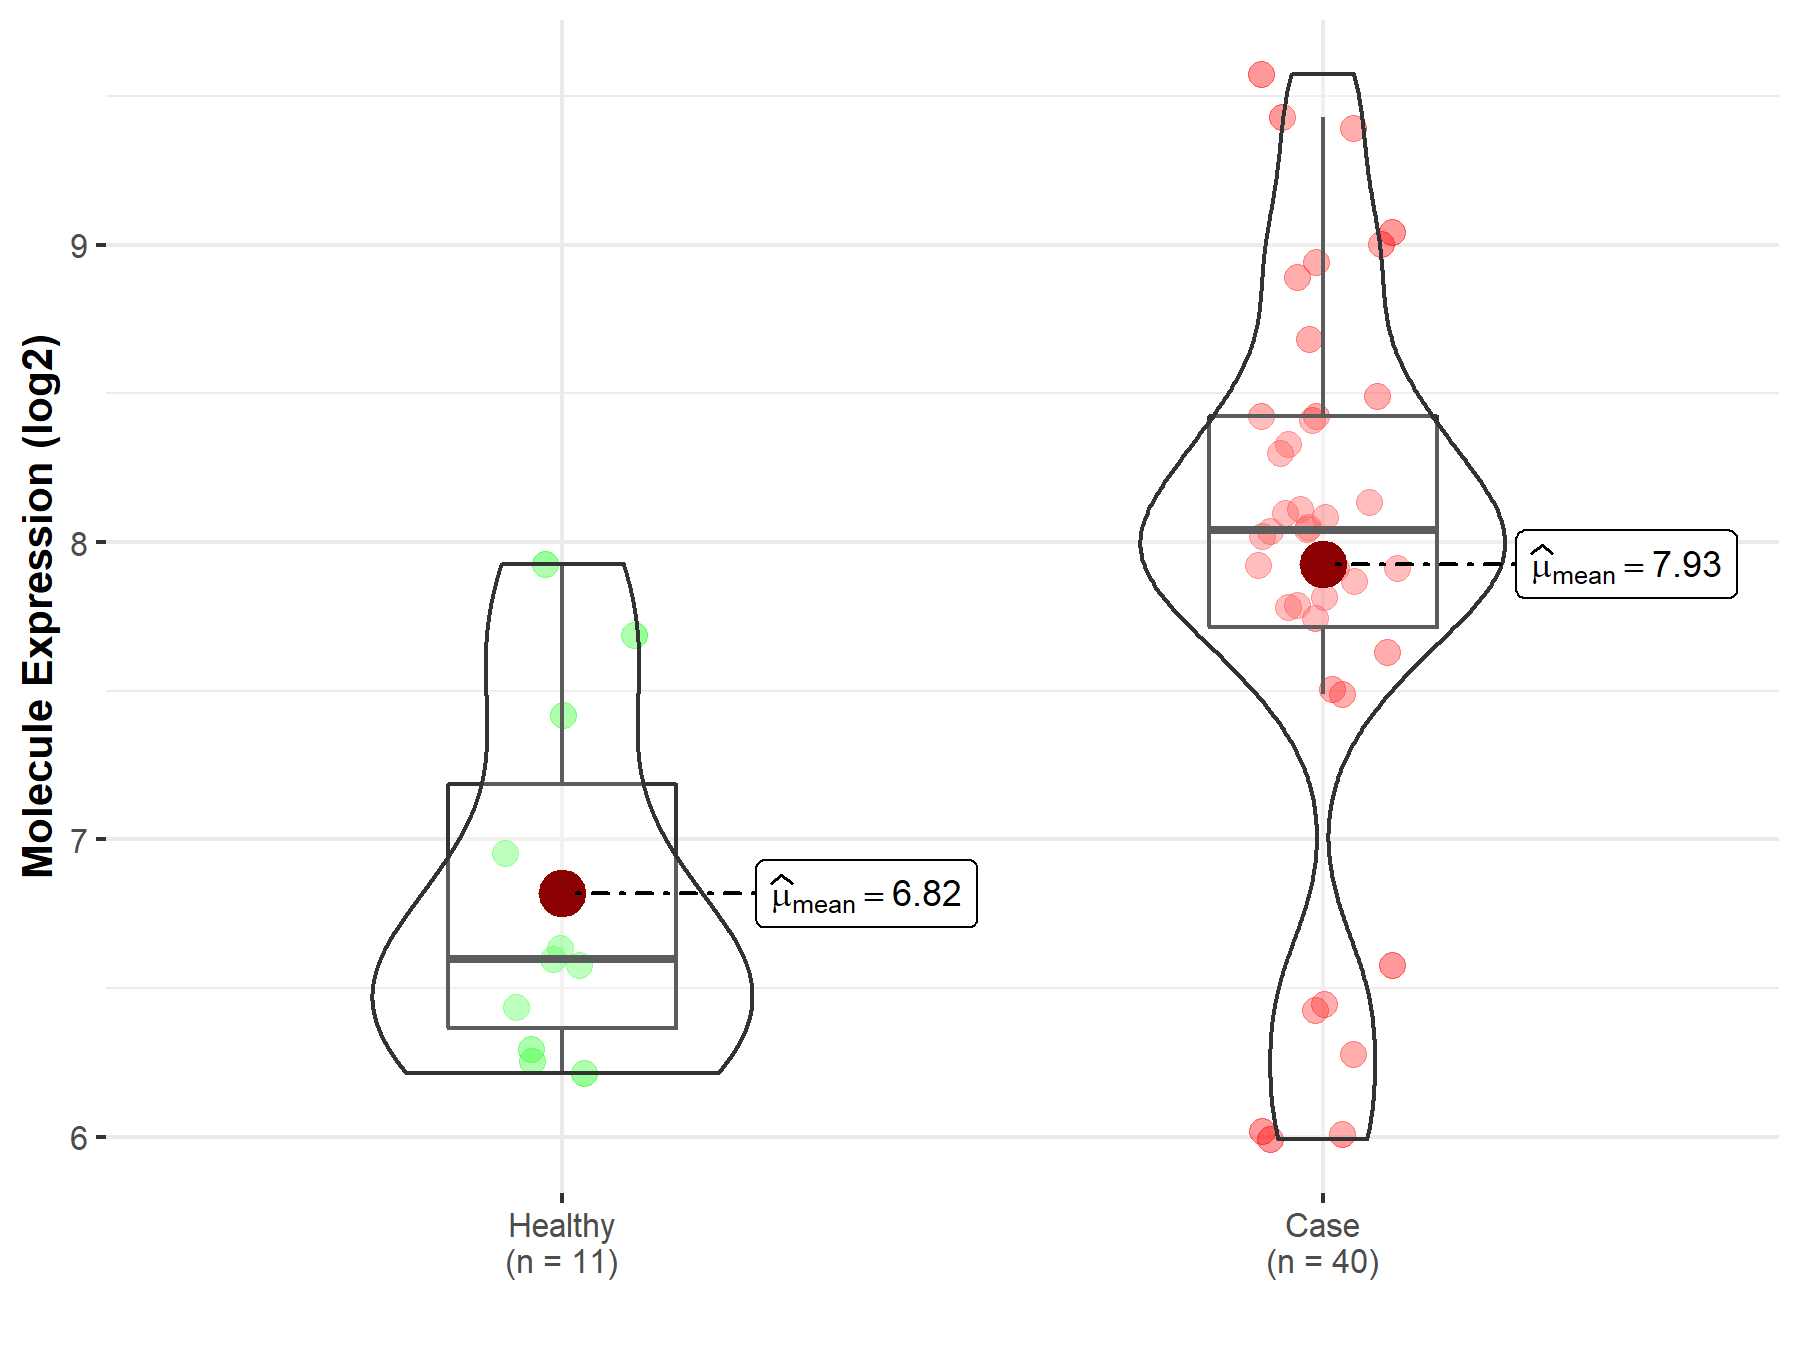
| Differential expression of the molecule in resistant disease | ||||
| Classification of Disease | Pancreatic cancer [ICD-11: 2C10] | |||
| The Specified Disease | Pancreatic cancer | |||
| The Studied Tissue | Pancreas | |||
| The Expression Level of Disease Section Compare with the Healthy Individual Tissue | p-value: 1.83E-04 Fold-change: 1.13E-01 Z-score: 3.86E+00 |
|||
| Experimental Note | Revealed Based on the Cell Line Data | |||
| Cell Pathway Regulation | Cell apoptosis | Inhibition | hsa04210 | |
| Cell proliferation | Activation | hsa05200 | ||
| In Vitro Model | BxPC-3 cells | Pancreas | Homo sapiens (Human) | CVCL_0186 |
| MIA PaCa-2 cells | Pancreas | Homo sapiens (Human) | CVCL_0428 | |
| PANC-1 cells | Pancreas | Homo sapiens (Human) | CVCL_0480 | |
| Capan-1 cells | Pancreas | Homo sapiens (Human) | CVCL_0237 | |
| In Vivo Model | Nude mouse xenograft model | Mus musculus | ||
| Experiment for Molecule Alteration |
Luciferase reporter assay; Western blot analysis; RT-qPCR | |||
| Experiment for Drug Resistance |
MTT assay; Flow cytometry assay; Soft agar assay | |||
| Mechanism Description | Long non-coding RNA LINC00346 promotes pancreatic cancer growth and gemcitabine resistance by sponging miR-188-3p to derepress BRD4 expression. | |||
Investigative Drug(s)
1 drug(s) in total
| Drug Resistance Data Categorized by Their Corresponding Mechanisms | ||||
|
|
||||
| Disease Class: Glioblastoma [ICD-11: 2A00.02] | [2] | |||
| Resistant Disease | Glioblastoma [ICD-11: 2A00.02] | |||
| Resistant Drug | I-BET151 | |||
| Molecule Alteration | Expression | Up-regulation |
||
| Differential expression of the molecule in resistant disease | ||||
| Classification of Disease | Brain cancer [ICD-11: 2A00] | |||
| The Specified Disease | Neuroectodermal tumor | |||
| The Studied Tissue | Brainstem tissue | |||
| The Expression Level of Disease Section Compare with the Healthy Individual Tissue | p-value: 2.90E-08 Fold-change: 1.04E-01 Z-score: 9.87E+00 |
|||
| Experimental Note | Identified from the Human Clinical Data | |||
| Cell Pathway Regulation | Cell apoptosis | Inhibition | hsa04210 | |
| Cell proliferation | Activation | hsa05200 | ||
| In Vitro Model | U87Luc cells | Brain | Homo sapiens (Human) | CVCL_5J12 |
| In Vivo Model | Nude mouse xenograft model | Mus musculus | ||
| Experiment for Molecule Alteration |
qPCR | |||
| Experiment for Drug Resistance |
Colony forming assay; Flow cytometry assay | |||
| Mechanism Description | The Bromodomain protein BRD4 controls HOTAIR, a long noncoding RNA essential for glioblastoma proliferation to promote I-bet151 resistance in Glioblastoma. | |||
Disease- and Tissue-specific Abundances of This Molecule
ICD Disease Classification 02

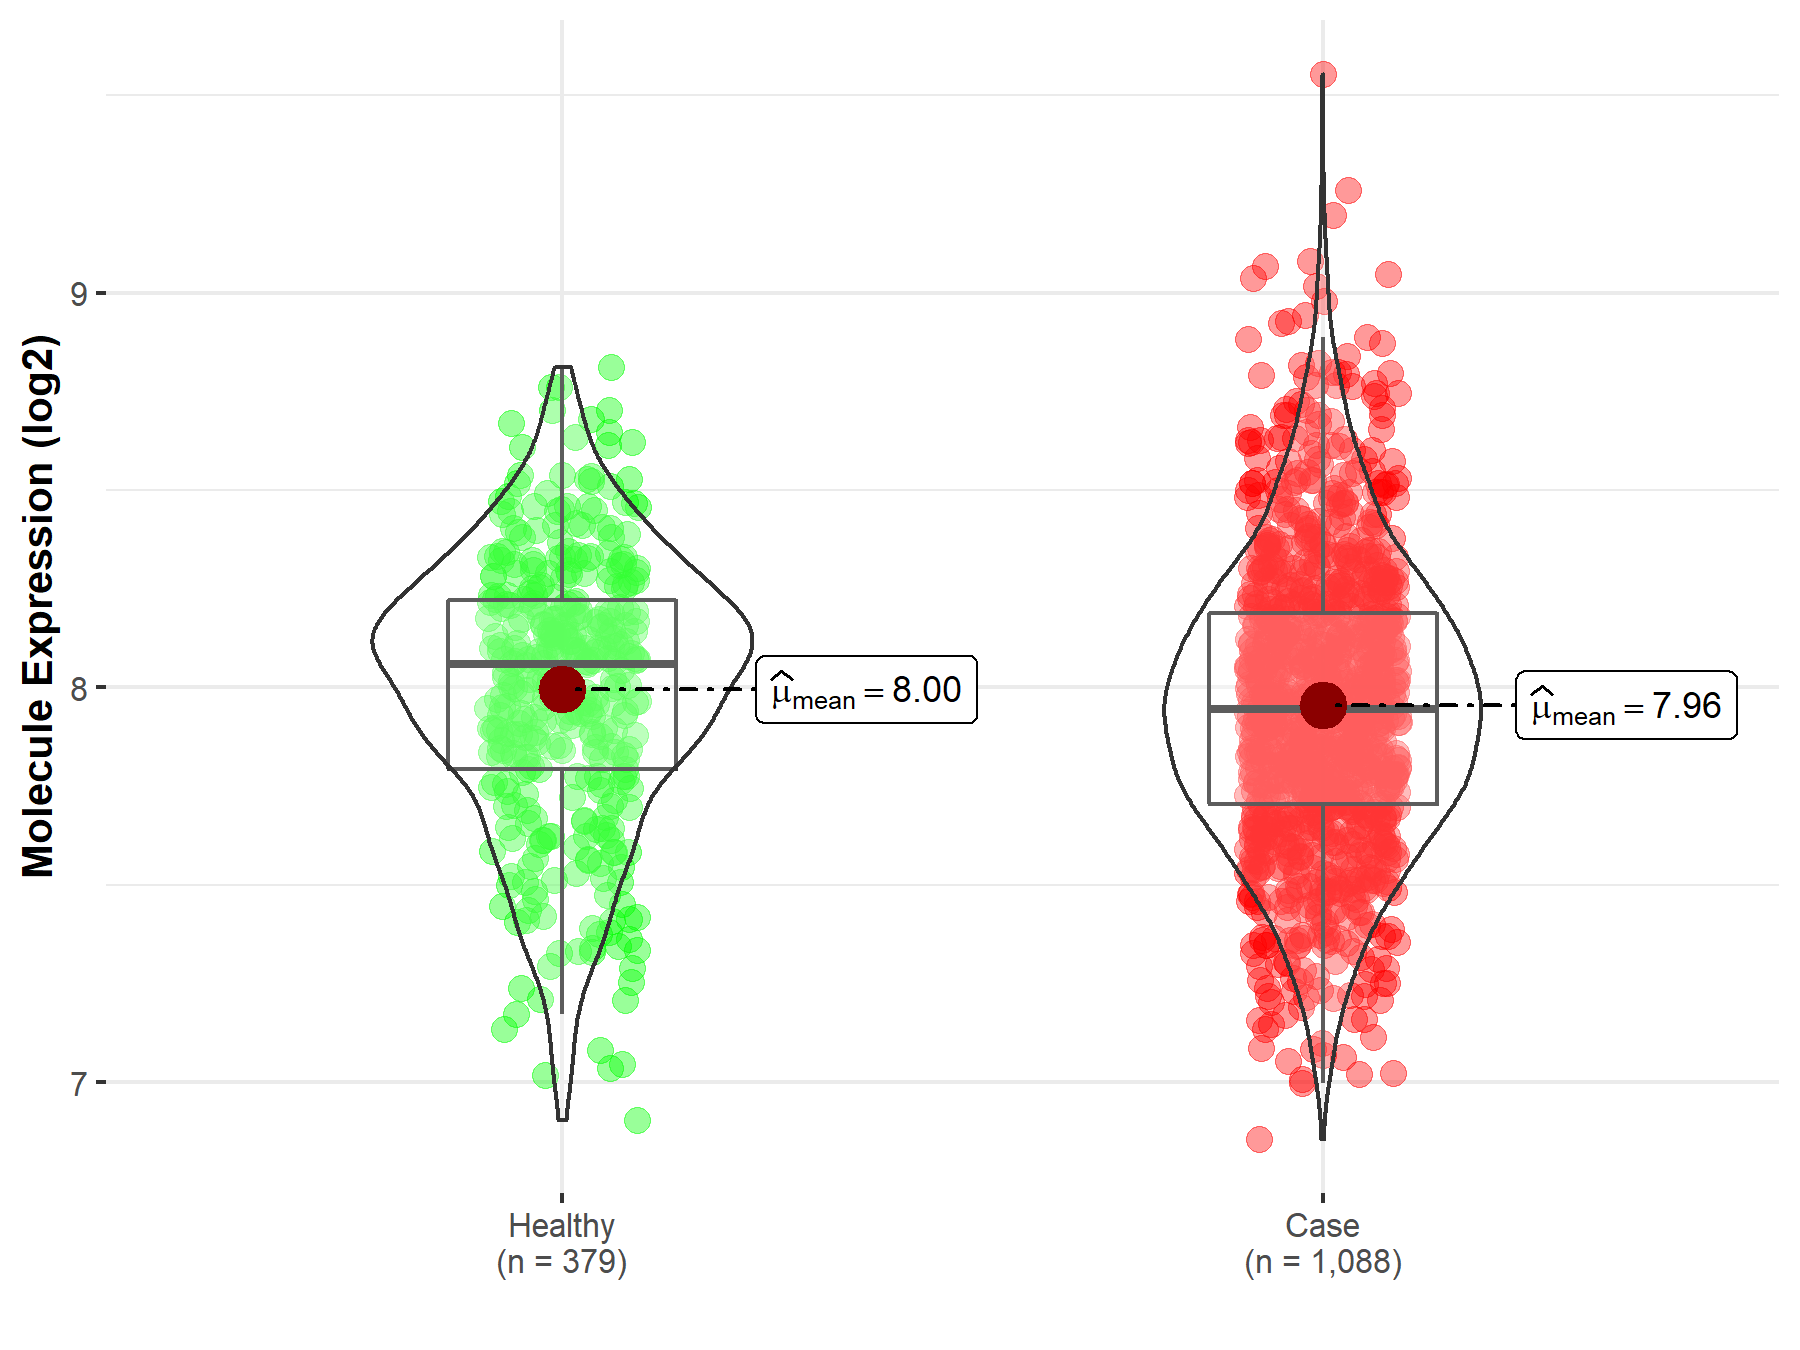
| Differential expression of molecule in resistant diseases | ||
| The Studied Tissue | Nervous tissue | |
| The Specified Disease | Brain cancer | |
| The Expression Level of Disease Section Compare with the Healthy Individual Tissue | p-value: 5.90E-02; Fold-change: -1.14E-01; Z-score: -3.29E-01 | |
|
Molecule expression in the diseased tissue of patients
Molecule expression in the normal tissue of healthy individuals
|
||
| Disease-specific Molecule Abundances |

|
Click to View the Clearer Original Diagram |
| The Studied Tissue | Brainstem tissue | |
| The Specified Disease | Glioma | |
| The Expression Level of Disease Section Compare with the Healthy Individual Tissue | p-value: 7.72E-01; Fold-change: -1.81E-01; Z-score: -9.80E-01 | |
|
Molecule expression in the diseased tissue of patients
Molecule expression in the normal tissue of healthy individuals
|
||
| Disease-specific Molecule Abundances |

|
Click to View the Clearer Original Diagram |
| The Studied Tissue | White matter | |
| The Specified Disease | Glioma | |
| The Expression Level of Disease Section Compare with the Healthy Individual Tissue | p-value: 7.38E-05; Fold-change: 1.45E+00; Z-score: 2.41E+00 | |
|
Molecule expression in the diseased tissue of patients
Molecule expression in the normal tissue of healthy individuals
|
||
| Disease-specific Molecule Abundances |

|
Click to View the Clearer Original Diagram |
| The Studied Tissue | Brainstem tissue | |
| The Specified Disease | Neuroectodermal tumor | |
| The Expression Level of Disease Section Compare with the Healthy Individual Tissue | p-value: 2.90E-08; Fold-change: 5.48E-01; Z-score: 3.65E+00 | |
|
Molecule expression in the diseased tissue of patients
Molecule expression in the normal tissue of healthy individuals
|
||
| Disease-specific Molecule Abundances |

|
Click to View the Clearer Original Diagram |
| Differential expression of molecule in resistant diseases | ||
| The Studied Tissue | Pancreas | |
| The Specified Disease | Pancreatic cancer | |
| The Expression Level of Disease Section Compare with the Healthy Individual Tissue | p-value: 9.37E-01; Fold-change: -3.82E-02; Z-score: -8.82E-02 | |
| The Expression Level of Disease Section Compare with the Adjacent Tissue | p-value: 4.29E-05; Fold-change: 1.92E-01; Z-score: 6.35E-01 | |
|
Molecule expression in the normal tissue adjacent to the diseased tissue of patients
Molecule expression in the diseased tissue of patients
Molecule expression in the normal tissue of healthy individuals
|
||
| Disease-specific Molecule Abundances |

|
Click to View the Clearer Original Diagram |
Tissue-specific Molecule Abundances in Healthy Individuals


|
||
References
If you find any error in data or bug in web service, please kindly report it to Dr. Sun and Dr. Yu.
