Molecule Information
General Information of the Molecule (ID: Mol00247)
| Name |
BAG family molecular chaperone regulator 3 (BAG3)
,Homo sapiens
|
||||
|---|---|---|---|---|---|
| Synonyms |
BAG-3; Bcl-2-associated athanogene 3; Bcl-2-binding protein Bis; Docking protein CAIR-1; BIS
Click to Show/Hide
|
||||
| Molecule Type |
Protein
|
||||
| Gene Name |
BAG3
|
||||
| Gene ID | |||||
| Location |
chr10:119651380-119677819[+]
|
||||
| Sequence |
MSAATHSPMMQVASGNGDRDPLPPGWEIKIDPQTGWPFFVDHNSRTTTWNDPRVPSEGPK
ETPSSANGPSREGSRLPPAREGHPVYPQLRPGYIPIPVLHEGAENRQVHPFHVYPQPGMQ RFRTEAAAAAPQRSQSPLRGMPETTQPDKQCGQVAAAAAAQPPASHGPERSQSPAASDCS SSSSSASLPSSGRSSLGSHQLPRGYISIPVIHEQNVTRPAAQPSFHQAQKTHYPAQQGEY QTHQPVYHKIQGDDWEPRPLRAASPFRSSVQGASSREGSPARSSTPLHSPSPIRVHTVVD RPQQPMTHRETAPVSQPENKPESKPGPVGPELPPGHIPIQVIRKEVDSKPVSQKPPPPSE KVEVKVPPAPVPCPPPSPGPSAVPSSPKSVATEERAAPSTAPAEATPPKPGEAEAPPKHP GVLKVEAILEKVQGLEQAVDNFEGKKTDKKYLMIEEYLTKELLALDSVDPEGRADVRQAR RDGVRKVQTILEKLEQKAIDVPGQVQVYELQPSNLEADQPLQAIMEMGAVAADKGKKNAG NAEDPHTETQQPEATAAATSNPSSMTDTPGNPAAP Click to Show/Hide
|
||||
| Function |
Co-chaperone for HSP70 and HSC70 chaperone proteins. Acts as a nucleotide-exchange factor (NEF) promoting the release of ADP from the HSP70 and HSC70 proteins thereby triggering client/substrate protein release. Nucleotide release is mediated via its binding to the nucleotide-binding domain (NBD) of HSPA8/HSC70 where as the substrate release is mediated via its binding to the substrate-binding domain (SBD) of HSPA8/HSC70. Has anti-apoptotic activity. Plays a role in the HSF1 nucleocytoplasmic transport.
Click to Show/Hide
|
||||
| Uniprot ID | |||||
| Ensembl ID | |||||
| HGNC ID | |||||
| Click to Show/Hide the Complete Species Lineage | |||||
Type(s) of Resistant Mechanism of This Molecule
Drug Resistance Data Categorized by Drug
Investigative Drug(s)
1 drug(s) in total
| Drug Sensitivity Data Categorized by Their Corresponding Mechanisms | ||||
|
|
||||
| Disease Class: Glioblastoma [ICD-11: 2A00.02] | [1] | |||
| Sensitive Disease | Glioblastoma [ICD-11: 2A00.02] | |||
| Sensitive Drug | Isoarnebin 4 | |||
| Molecule Alteration | Expression | Down-regulation |
||
| Differential expression of the molecule in resistant disease | ||||
| Classification of Disease | Brain cancer [ICD-11: 2A00] | |||
| The Specified Disease | Neuroectodermal tumor | |||
| The Studied Tissue | Brainstem tissue | |||
| The Expression Level of Disease Section Compare with the Healthy Individual Tissue | p-value: 3.31E-08 Fold-change: -2.29E-01 Z-score: -9.50E+00 |
|||
| Experimental Note | Revealed Based on the Cell Line Data | |||
| Cell Pathway Regulation | Cell apoptosis | Activation | hsa04210 | |
| Cell proliferation | Inhibition | hsa05200 | ||
| Mitochondrial apoptotic signaling pathway | Activation | hsa04210 | ||
| In Vitro Model | GBM cells | Brain | Homo sapiens (Human) | N.A. |
| In Vivo Model | Nude mouse xenograft model | Mus musculus | ||
| Experiment for Molecule Alteration |
Western blot analysis | |||
| Experiment for Drug Resistance |
CCK8 assay; Flow cytometry assay | |||
| Mechanism Description | miR-143 enhances the antitumor activity of shikonin by targeting BAG3 and reducing its expression in human glioblastoma stem cell. | |||
Disease- and Tissue-specific Abundances of This Molecule
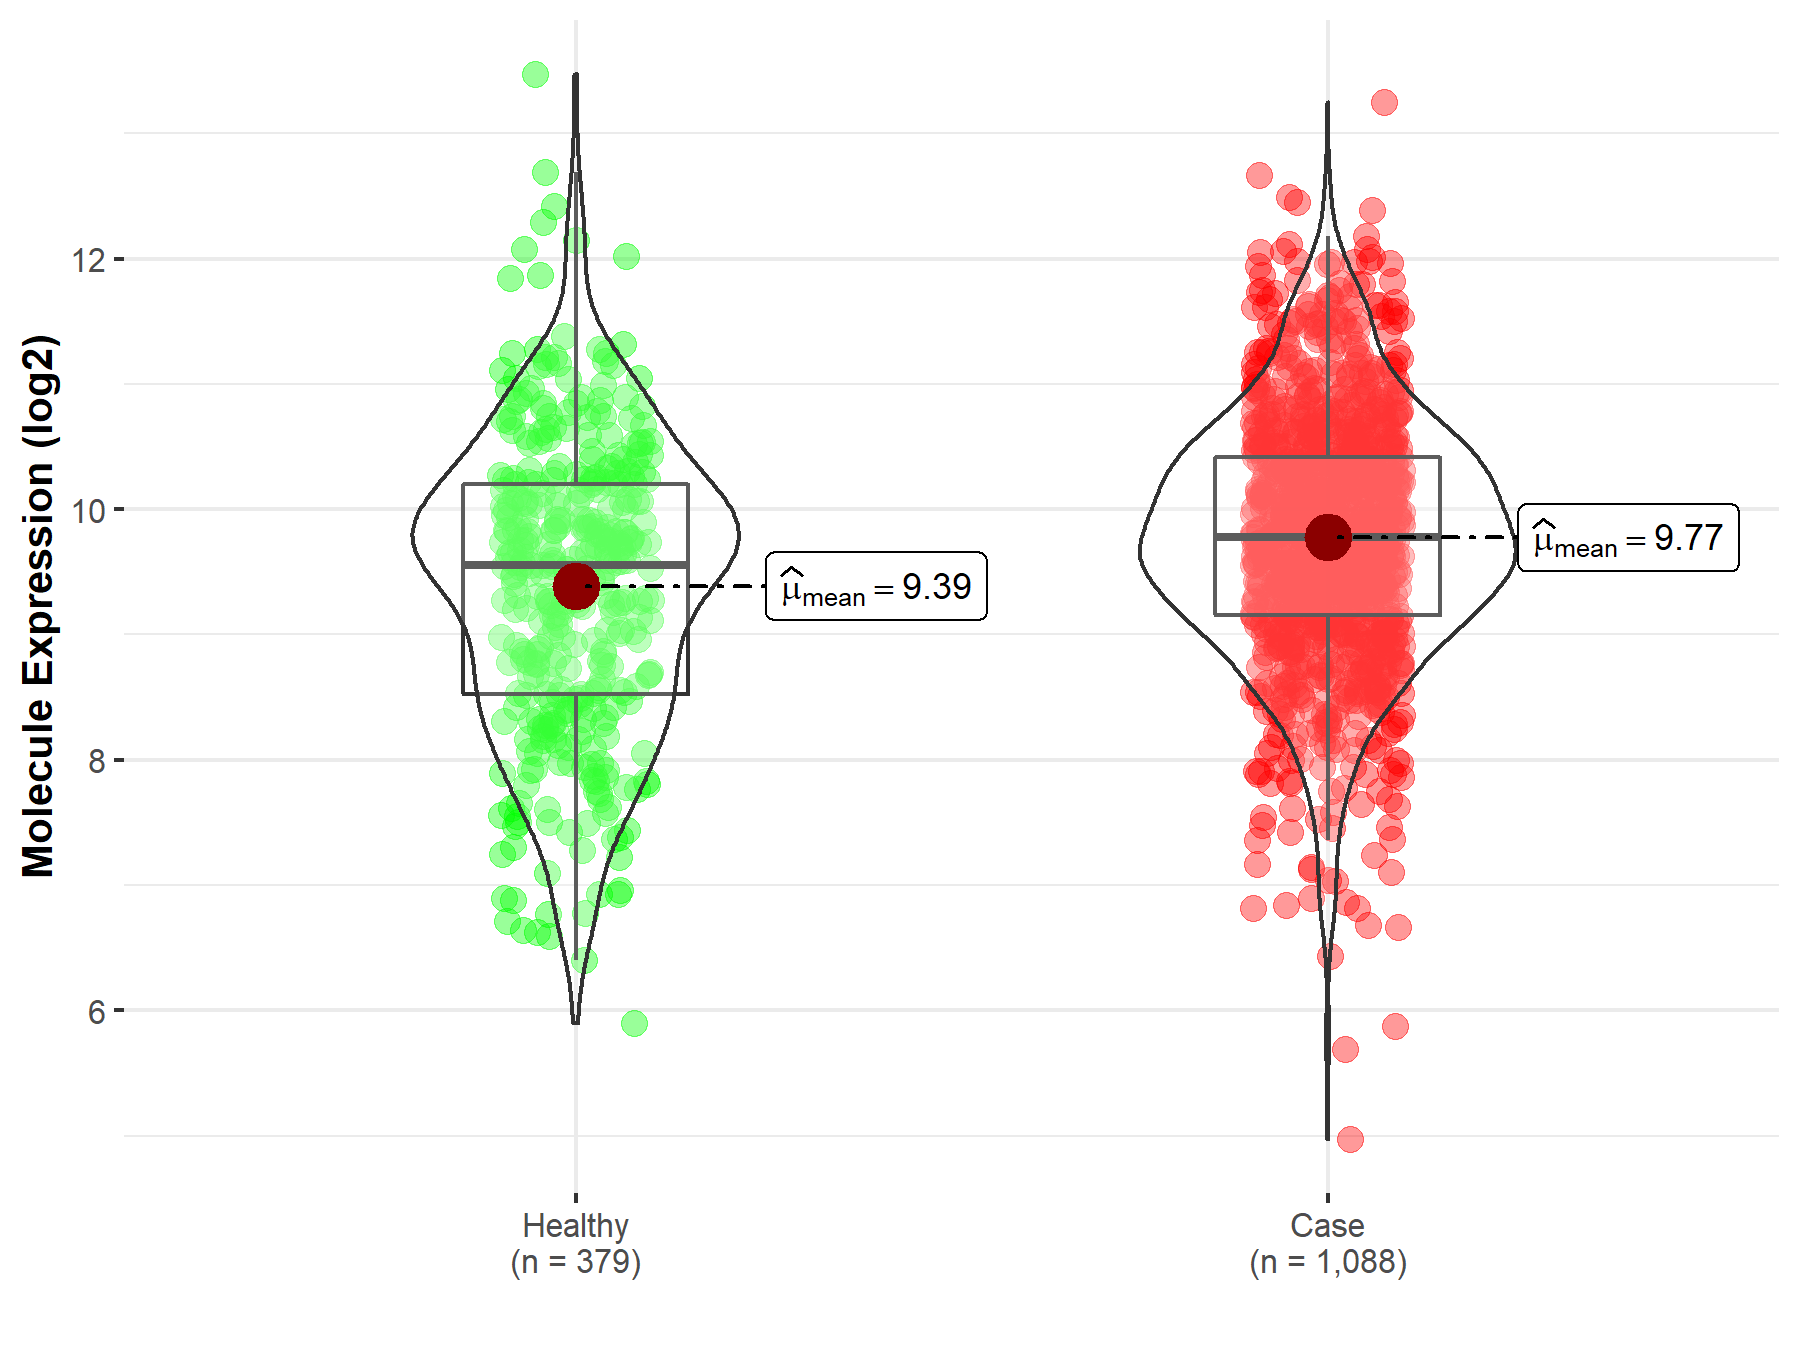
ICD Disease Classification 02

| Differential expression of molecule in resistant diseases | ||
| The Studied Tissue | Nervous tissue | |
| The Specified Disease | Brain cancer | |
| The Expression Level of Disease Section Compare with the Healthy Individual Tissue | p-value: 2.69E-08; Fold-change: 2.21E-01; Z-score: 1.85E-01 | |
|
Molecule expression in the diseased tissue of patients
Molecule expression in the normal tissue of healthy individuals
|
||
| Disease-specific Molecule Abundances |
|
Click to View the Clearer Original Diagram |
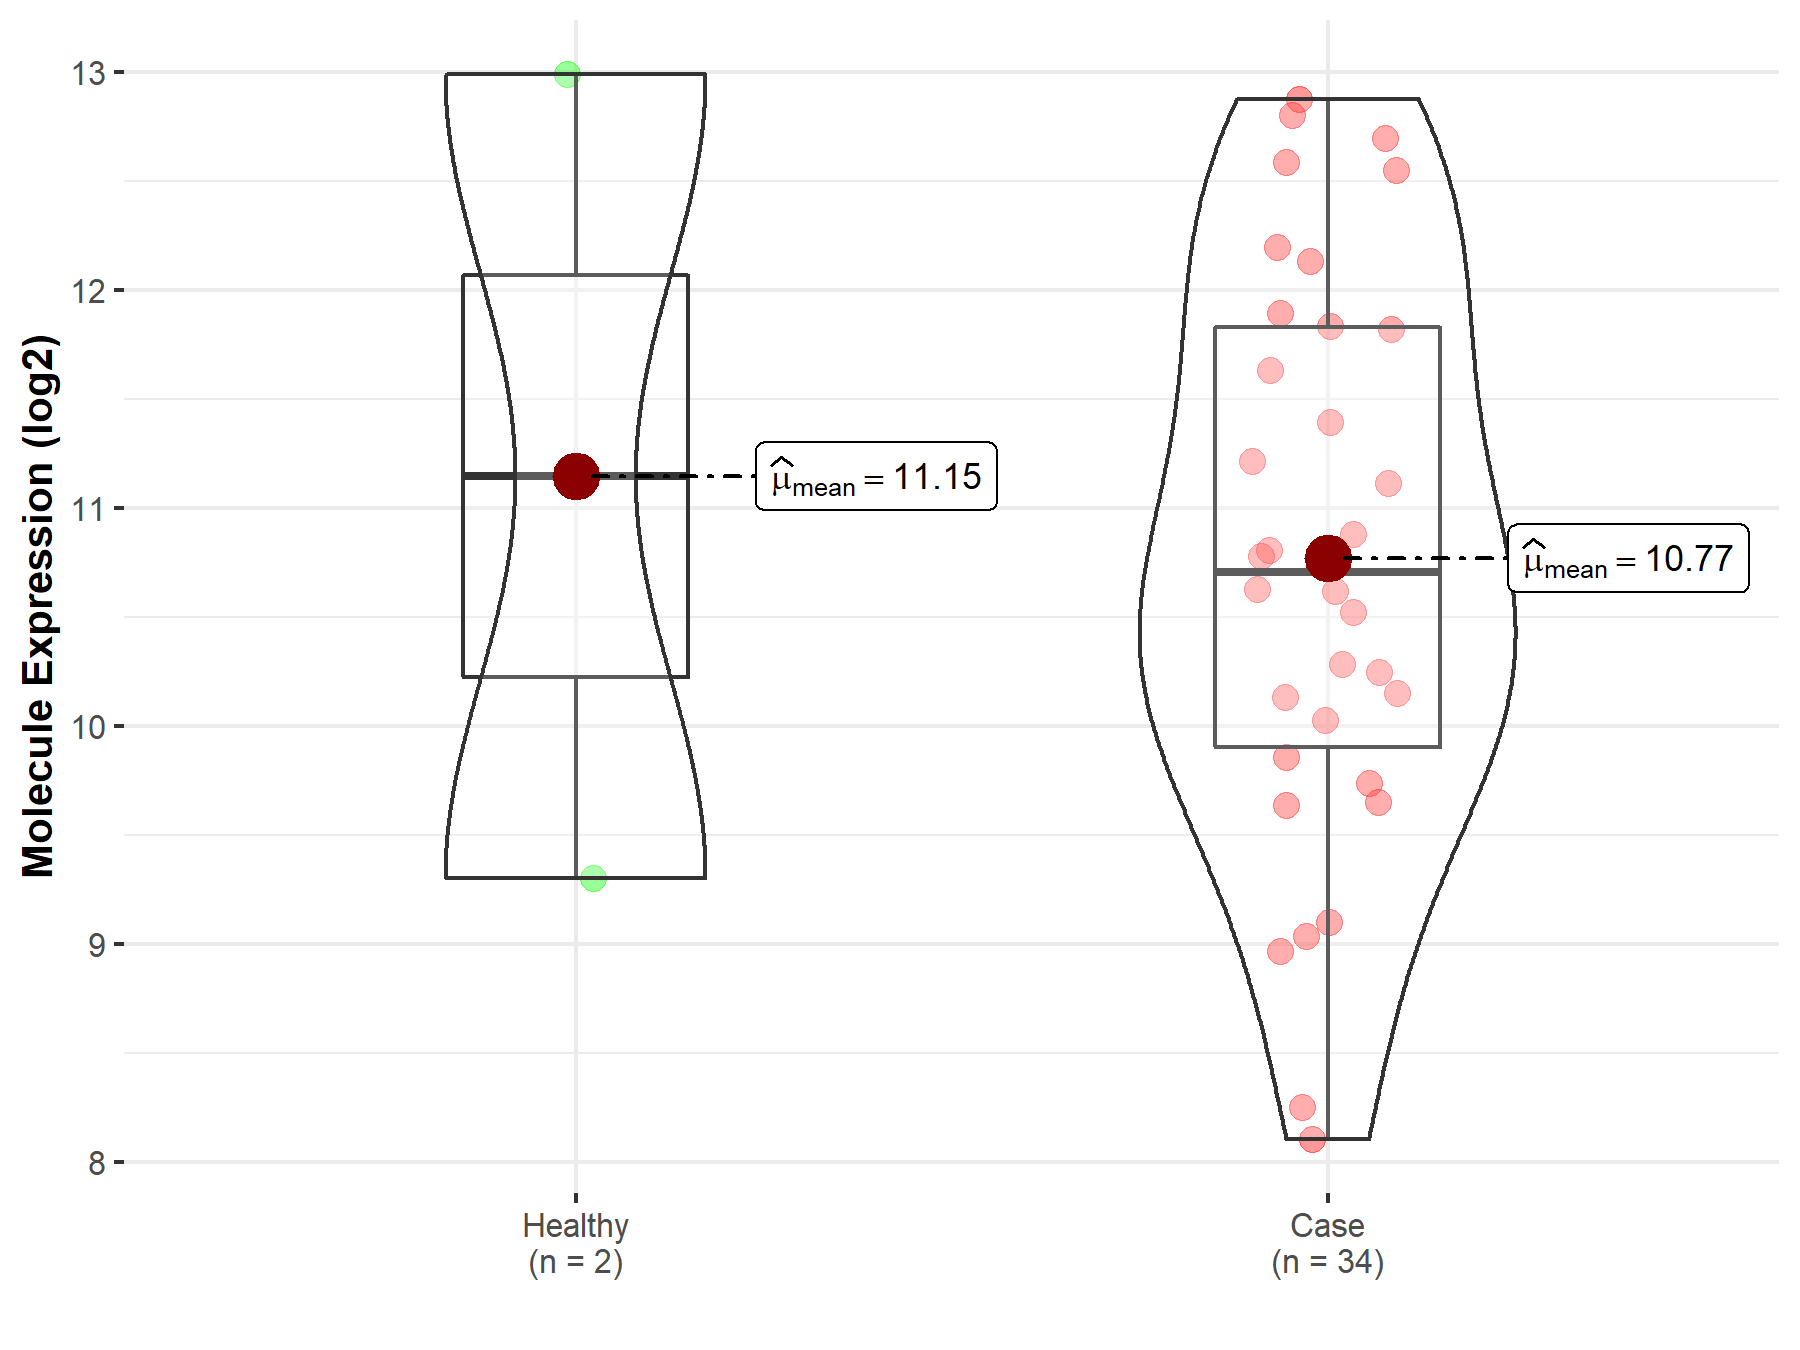
| The Studied Tissue | Brainstem tissue | |
| The Specified Disease | Glioma | |
| The Expression Level of Disease Section Compare with the Healthy Individual Tissue | p-value: 8.72E-01; Fold-change: -4.42E-01; Z-score: -1.69E-01 | |
|
Molecule expression in the diseased tissue of patients
Molecule expression in the normal tissue of healthy individuals
|
||
| Disease-specific Molecule Abundances |
|
Click to View the Clearer Original Diagram |
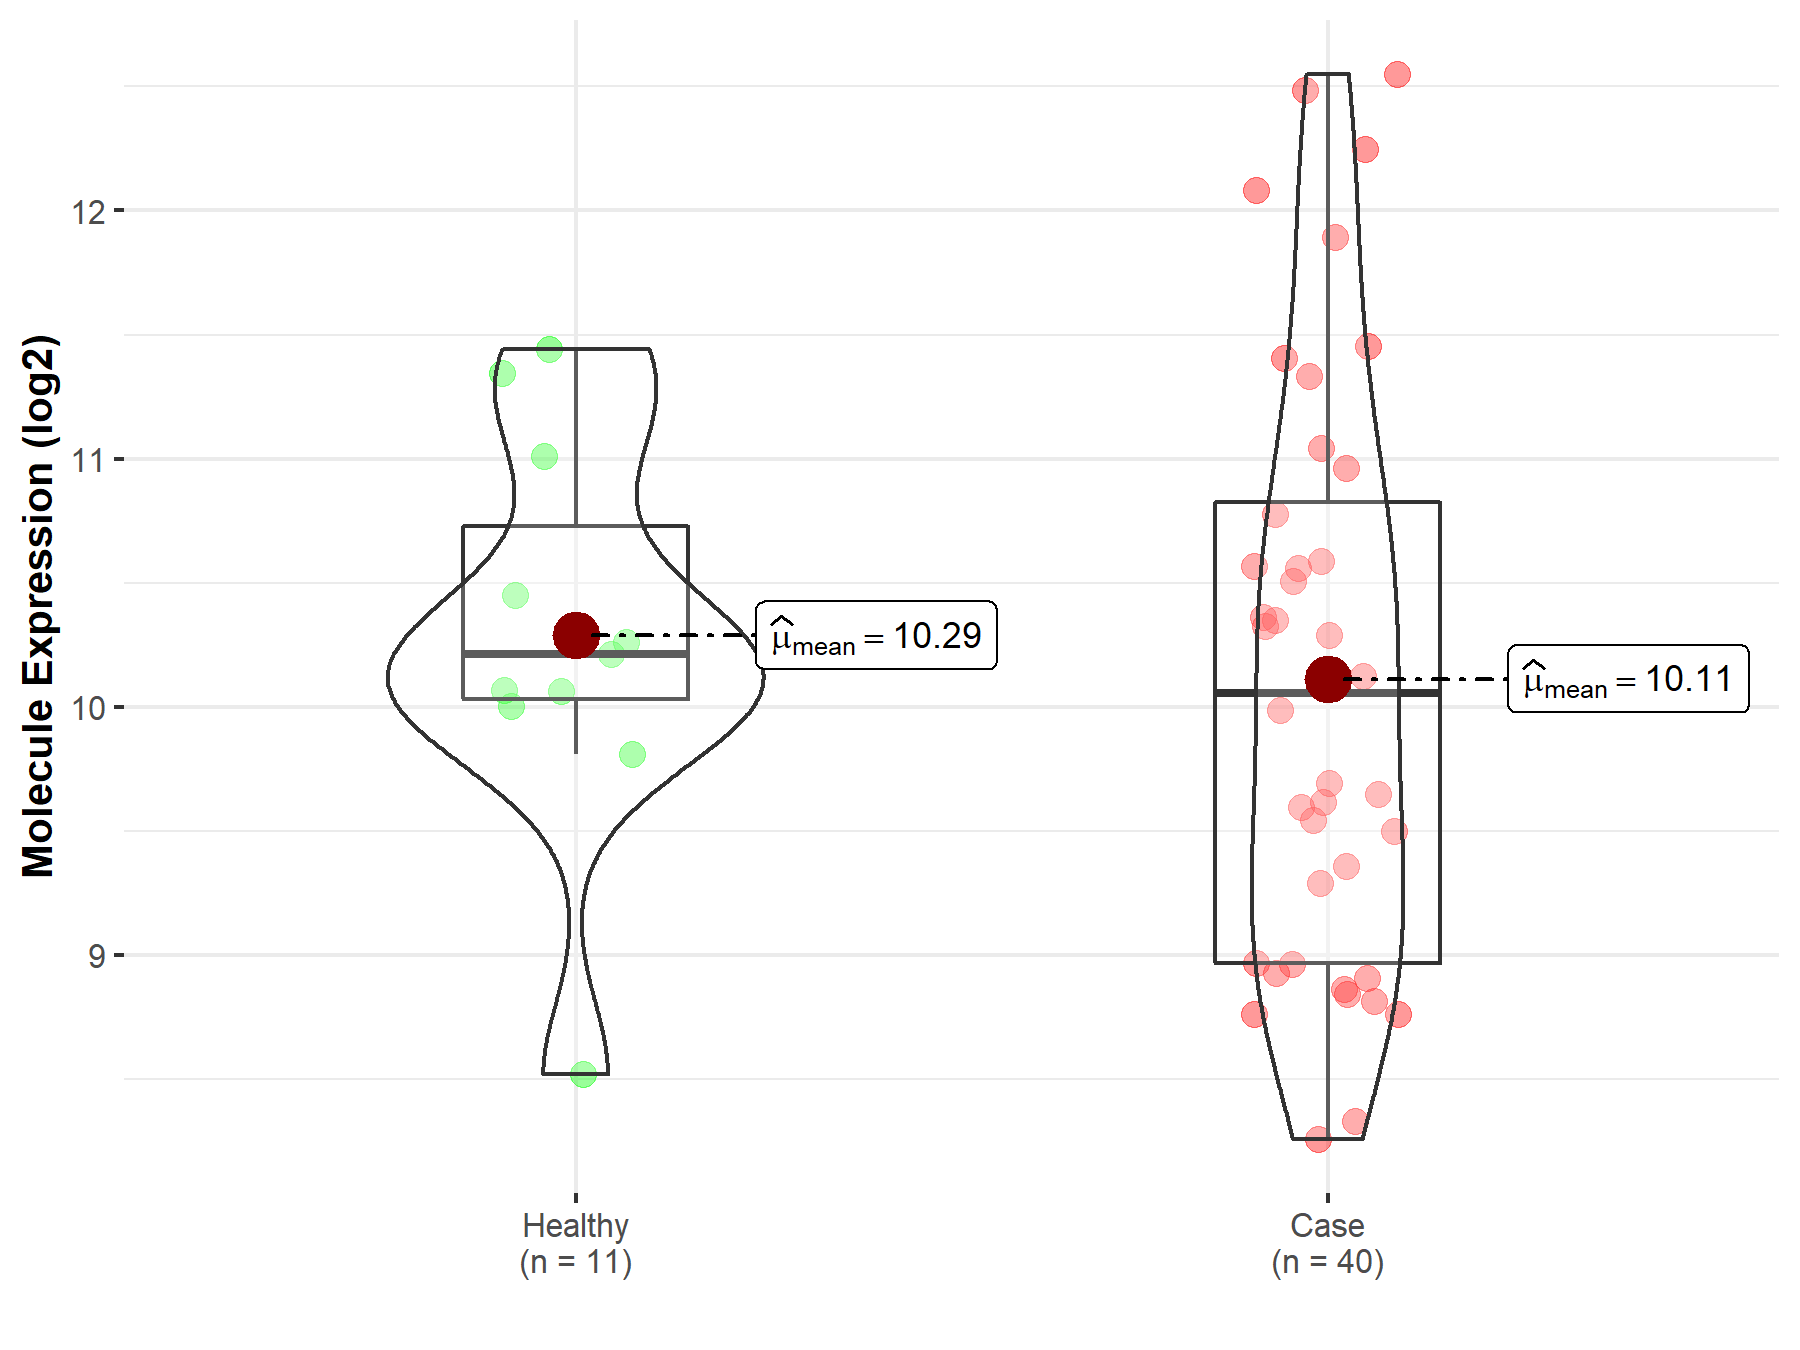
| The Studied Tissue | White matter | |
| The Specified Disease | Glioma | |
| The Expression Level of Disease Section Compare with the Healthy Individual Tissue | p-value: 5.74E-01; Fold-change: -1.54E-01; Z-score: -1.91E-01 | |
|
Molecule expression in the diseased tissue of patients
Molecule expression in the normal tissue of healthy individuals
|
||
| Disease-specific Molecule Abundances |
|
Click to View the Clearer Original Diagram |
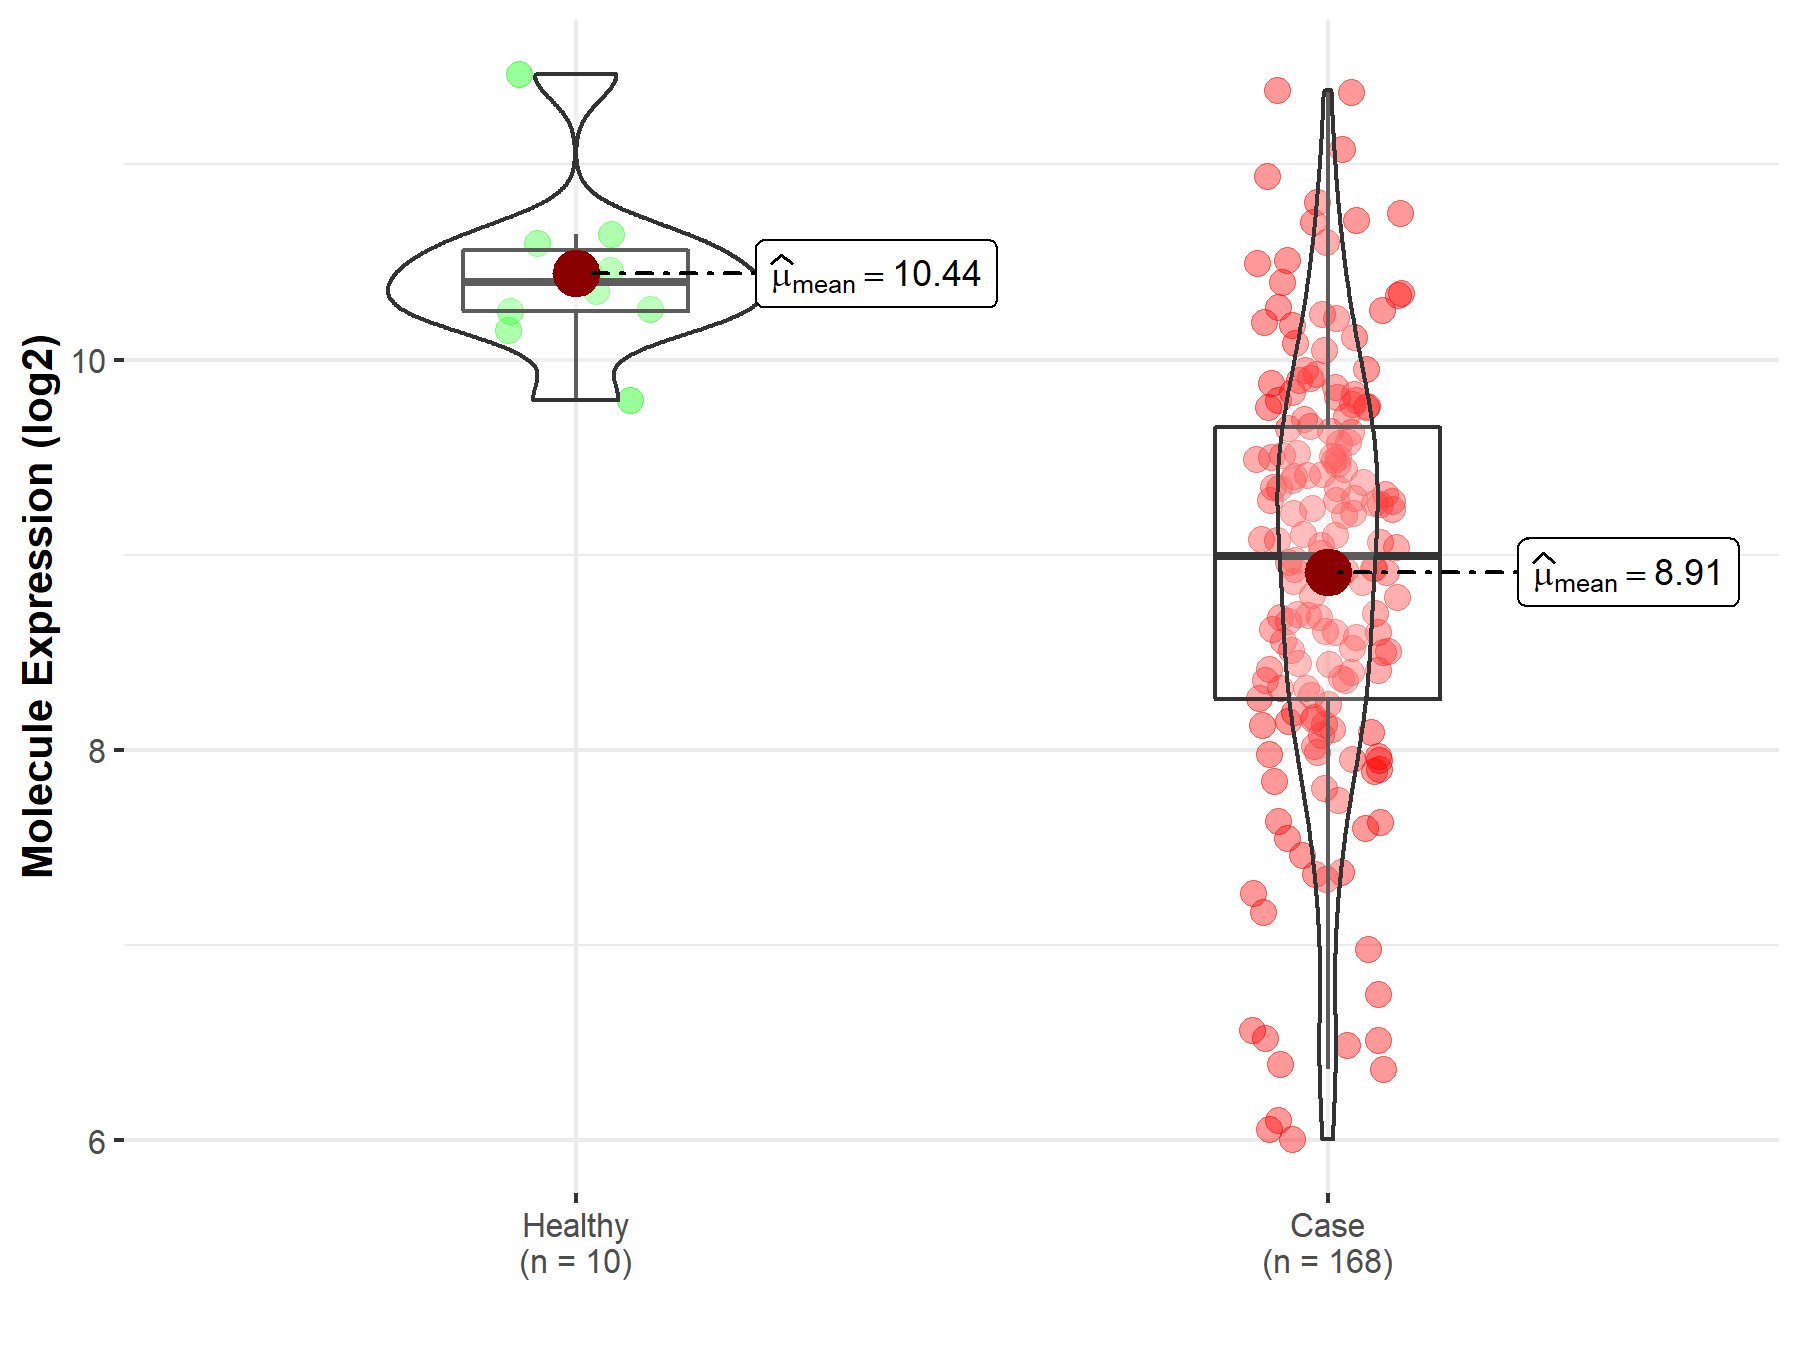
| The Studied Tissue | Brainstem tissue | |
| The Specified Disease | Neuroectodermal tumor | |
| The Expression Level of Disease Section Compare with the Healthy Individual Tissue | p-value: 3.31E-08; Fold-change: -1.41E+00; Z-score: -3.24E+00 | |
|
Molecule expression in the diseased tissue of patients
Molecule expression in the normal tissue of healthy individuals
|
||
| Disease-specific Molecule Abundances |
|
Click to View the Clearer Original Diagram |
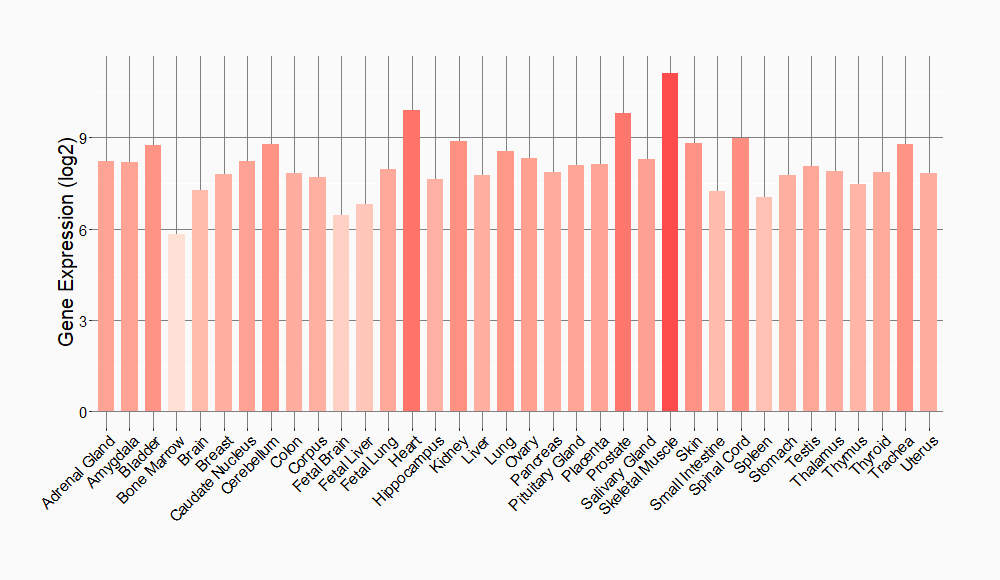
Tissue-specific Molecule Abundances in Healthy Individuals

|
||
References
If you find any error in data or bug in web service, please kindly report it to Dr. Sun and Dr. Yu.
