Molecule Information
General Information of the Molecule (ID: Mol00222)
| Name |
RAC-gamma serine/threonine-protein kinase (AKT3)
,Homo sapiens
|
||||
|---|---|---|---|---|---|
| Synonyms |
Protein kinase Akt-3; Protein kinase B gamma; PKB gamma; RAC-PK-gamma; STK-2; PKBG
Click to Show/Hide
|
||||
| Molecule Type |
Protein
|
||||
| Gene Name |
AKT3
|
||||
| Gene ID | |||||
| Location |
chr1:243488233-243851079[-]
|
||||
| Sequence |
MSDVTIVKEGWVQKRGEYIKNWRPRYFLLKTDGSFIGYKEKPQDVDLPYPLNNFSVAKCQ
LMKTERPKPNTFIIRCLQWTTVIERTFHVDTPEEREEWTEAIQAVADRLQRQEEERMNCS PTSQIDNIGEEEMDASTTHHKRKTMNDFDYLKLLGKGTFGKVILVREKASGKYYAMKILK KEVIIAKDEVAHTLTESRVLKNTRHPFLTSLKYSFQTKDRLCFVMEYVNGGELFFHLSRE RVFSEDRTRFYGAEIVSALDYLHSGKIVYRDLKLENLMLDKDGHIKITDFGLCKEGITDA ATMKTFCGTPEYLAPEVLEDNDYGRAVDWWGLGVVMYEMMCGRLPFYNQDHEKLFELILM EDIKFPRTLSSDAKSLLSGLLIKDPNKRLGGGPDDAKEIMRHSFFSGVNWQDVYDKKLVP PFKPQVTSETDTRYFDEEFTAQTITITPPEKYDEDGMDCMDNERRPHFPQFSYSASGRE Click to Show/Hide
|
||||
| 3D-structure |
|
||||
| Function |
AKT3 is one of 3 closely related serine/threonine-protein kinases (AKT1, AKT2 and AKT3) called the AKT kinase, and which regulate many processes including metabolism, proliferation, cell survival, growth and angiogenesis. This is mediated through serine and/or threonine phosphorylation of a range of downstream substrates. Over 100 substrate candidates have been reported so far, but for most of them, no isoform specificity has been reported. AKT3 is the least studied AKT isoform. It plays an important role in brain development and is crucial for the viability of malignant glioma cells. AKT3 isoform may also be the key molecule in up-regulation and down-regulation of MMP13 via IL13. Required for the coordination of mitochondrial biogenesis with growth factor-induced increases in cellular energy demands. Down-regulation by RNA interference reduces the expression of the phosphorylated form of BAD, resulting in the induction of caspase-dependent apoptosis.
Click to Show/Hide
|
||||
| Uniprot ID | |||||
| Ensembl ID | |||||
| HGNC ID | |||||
| Click to Show/Hide the Complete Species Lineage | |||||
Type(s) of Resistant Mechanism of This Molecule
Drug Resistance Data Categorized by Drug
Approved Drug(s)
1 drug(s) in total
| Drug Resistance Data Categorized by Their Corresponding Mechanisms | ||||
|
|
||||
| Disease Class: Ovarian cancer [ICD-11: 2C73.0] | [1] | |||
| Resistant Disease | Ovarian cancer [ICD-11: 2C73.0] | |||
| Resistant Drug | Cisplatin | |||
| Molecule Alteration | Expression | Up-regulation |
||
| Experimental Note | Revealed Based on the Cell Line Data | |||
| Cell Pathway Regulation | Cell apoptosis | Inhibition | hsa04210 | |
| Cell proliferation | Activation | hsa05200 | ||
| In Vitro Model | SkOV3 cells | Ovary | Homo sapiens (Human) | CVCL_0532 |
| OVCAR3 cells | Ovary | Homo sapiens (Human) | CVCL_0465 | |
| In Vivo Model | Nude mouse xenograft model | Mus musculus | ||
| Experiment for Molecule Alteration |
Western blot analysis | |||
| Experiment for Drug Resistance |
MTT assay; Colony formation assay | |||
| Mechanism Description | miR-489 is downregulated in cisplatin (CDDP)-resistant ovarian cancer cells, SkOV3/CDDP and OVCAR3/CDDP cells. miR-489 overexpression results in an inhibition of SkOV3 and OVCAR3 cell survival and cell growth after CDDP treatment and an induction of cell apoptosis. Inhibition of miR-489 yields the opposite results. In addition, miR-489 overexpression increases the sensitivity of SkOV3/CDDP and OVCAR3/CDDP cells to CDDP and inhibits their colony number. Akt3 is validated as a direct target of miR-489 in SkOV3, OVCAR3, SkOV3/CDDP and OVCAR3/CDDP cells. miR-489 inhibited CDDP resistance and cell growth, and promotes apoptosis by suppressing Akt3 expression. | |||
Disease- and Tissue-specific Abundances of This Molecule
ICD Disease Classification 02

| Differential expression of molecule in resistant diseases | ||
| The Studied Tissue | Ovary | |
| The Specified Disease | Ovarian cancer | |
| The Expression Level of Disease Section Compare with the Healthy Individual Tissue | p-value: 1.87E-04; Fold-change: -2.31E+00; Z-score: -2.52E+00 | |
| The Expression Level of Disease Section Compare with the Adjacent Tissue | p-value: 2.95E-07; Fold-change: -1.77E+00; Z-score: -3.05E+00 | |
|
Molecule expression in the normal tissue adjacent to the diseased tissue of patients
Molecule expression in the diseased tissue of patients
Molecule expression in the normal tissue of healthy individuals
|
||
| Disease-specific Molecule Abundances |

|
Click to View the Clearer Original Diagram |
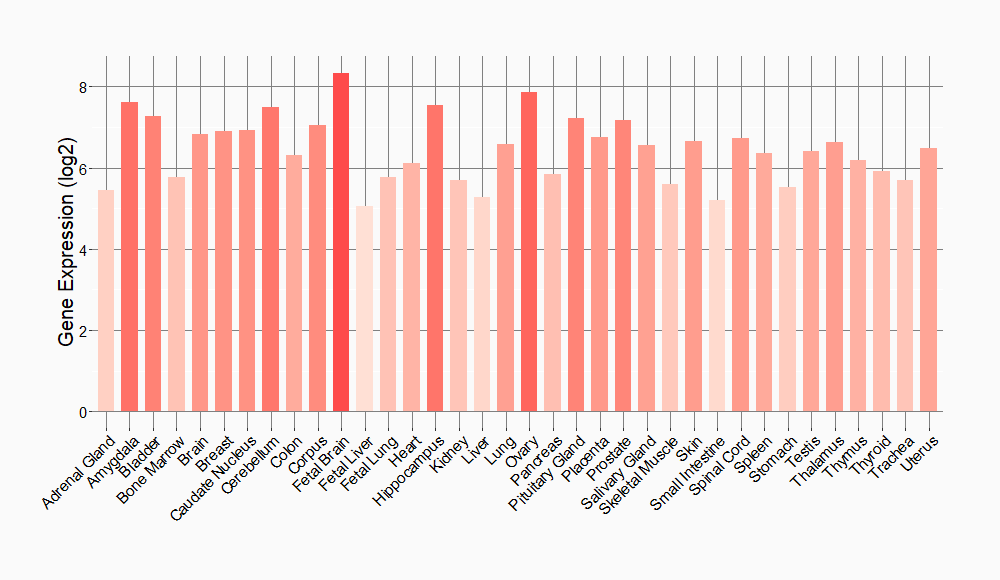
Tissue-specific Molecule Abundances in Healthy Individuals


|
||
References
If you find any error in data or bug in web service, please kindly report it to Dr. Sun and Dr. Yu.
