Molecule Information
General Information of the Molecule (ID: Mol00215)
| Name |
ADP/ATP translocase 2 (ANT2)
,Homo sapiens
|
||||
|---|---|---|---|---|---|
| Synonyms |
ADP;ATP carrier protein 2; ADP;ATP carrier protein; fibroblast isoform; Adenine nucleotide translocator 2; ANT 2; Solute carrier family 25 member 5; AAC2; ANT2
Click to Show/Hide
|
||||
| Molecule Type |
Protein
|
||||
| Gene Name |
SLC25A5
|
||||
| Gene ID | |||||
| Location |
chrX:119468422-119471396[+]
|
||||
| Sequence |
MTDAAVSFAKDFLAGGVAAAISKTAVAPIERVKLLLQVQHASKQITADKQYKGIIDCVVR
IPKEQGVLSFWRGNLANVIRYFPTQALNFAFKDKYKQIFLGGVDKRTQFWLYFAGNLASG GAAGATSLCFVYPLDFARTRLAADVGKAGAEREFRGLGDCLVKIYKSDGIKGLYQGFNVS VQGIIIYRAAYFGIYDTAKGMLPDPKNTHIVISWMIAQTVTAVAGLTSYPFDTVRRRMMM QSGRKGTDIMYTGTLDCWRKIARDEGGKAFFKGAWSNVLRGMGGAFVLVLYDEIKKYT Click to Show/Hide
|
||||
| Function |
ADP:ATP antiporter that mediates import of ADP into the mitochondrial matrix for ATP synthesis, and export of ATP out to fuel the cell. Cycles between the cytoplasmic-open state (c-state) and the matrix-open state (m-state): operates by the alternating access mechanism with a single substrate-binding site intermittently exposed to either the cytosolic (c-state) or matrix (m-state) side of the inner mitochondrial membrane. In addition to its ADP:ATP antiporter activity, also involved in mitochondrial uncoupling and mitochondrial permeability transition pore (mPTP) activity. Plays a role in mitochondrial uncoupling by acting as a proton transporter: proton transport uncouples the proton flows via the electron transport chain and ATP synthase to reduce the efficiency of ATP production and cause mitochondrial thermogenesis. Proton transporter activity is inhibited by ADP:ATP antiporter activity, suggesting that SLC25A5/ANT2 acts as a master regulator of mitochondrial energy output by maintaining a delicate balance between ATP production (ADP:ATP antiporter activity) and thermogenesis (proton transporter activity). Proton transporter activity requires free fatty acids as cofactor, but does not transport it. Probably mediates mitochondrial uncoupling in tissues that do not express UCP1. Also plays a key role in mPTP opening, a non-specific pore that enables free passage of the mitochondrial membranes to solutes of up to 1.5 kDa, and which contributes to cell death. It is however unclear if SLC25A5/ANT2 constitutes a pore-forming component of mPTP or regulates it. Acts as a regulator of mitophagy independently of ADP:ATP antiporter activity: promotes mitophagy via interaction with TIMM44, leading to inhibit the presequence translocase TIMM23, thereby promoting stabilization of PINK1. As part of the mitotic spindle-associated MMXD complex it may play a role in chromosome segregation.
Click to Show/Hide
|
||||
| Uniprot ID | |||||
| Ensembl ID | |||||
| HGNC ID | |||||
| Click to Show/Hide the Complete Species Lineage | |||||
Type(s) of Resistant Mechanism of This Molecule
Drug Resistance Data Categorized by Drug
Approved Drug(s)
1 drug(s) in total
| Drug Sensitivity Data Categorized by Their Corresponding Mechanisms | ||||
|
|
||||
| Disease Class: Hepatocellular carcinoma [ICD-11: 2C12.2] | [1] | |||
| Sensitive Disease | Hepatocellular carcinoma [ICD-11: 2C12.2] | |||
| Sensitive Drug | Sorafenib | |||
| Molecule Alteration | Expression | Up-regulation |
||
| Experimental Note | Identified from the Human Clinical Data | |||
| In Vitro Model | Huh-7 cells | Liver | Homo sapiens (Human) | CVCL_0336 |
| Huh7-R cells | Liver | Homo sapiens (Human) | CVCL_0336 | |
| Experiment for Molecule Alteration |
Western blot analysis | |||
| Experiment for Drug Resistance |
MTT assay; Wound healing assay; Anoikis assays | |||
| Mechanism Description | Upregulation of miR137 reverses sorafenib resistance and cancer-initiating cell phenotypes by degrading ANT2 in hepatocellular carcinoma. | |||
Disease- and Tissue-specific Abundances of This Molecule
ICD Disease Classification 02

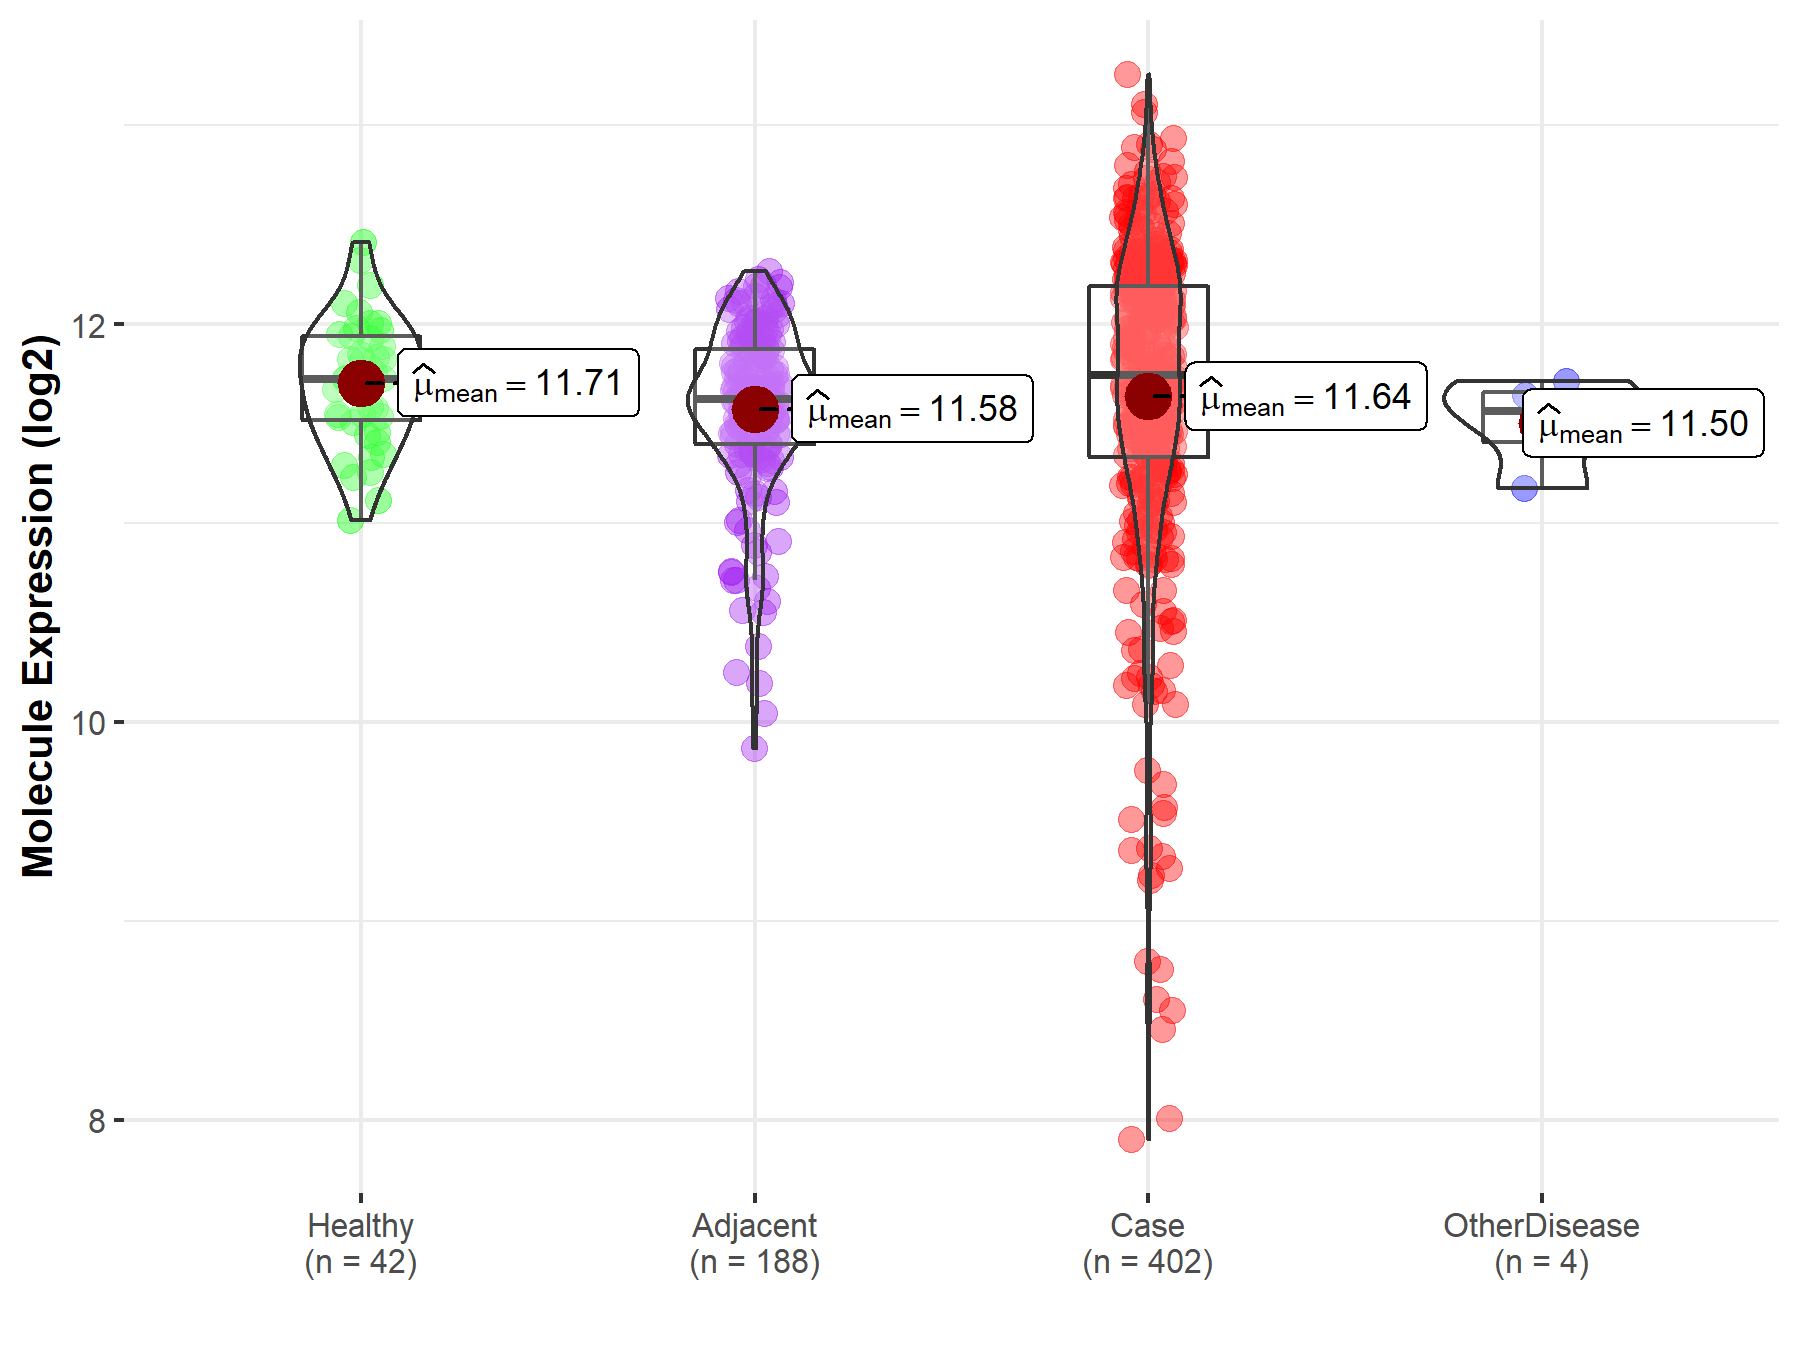
| Differential expression of molecule in resistant diseases | ||
| The Studied Tissue | Liver | |
| The Specified Disease | Liver cancer | |
| The Expression Level of Disease Section Compare with the Healthy Individual Tissue | p-value: 2.89E-01; Fold-change: 1.74E-02; Z-score: 5.51E-02 | |
| The Expression Level of Disease Section Compare with the Adjacent Tissue | p-value: 2.22E-01; Fold-change: 1.18E-01; Z-score: 2.77E-01 | |
| The Expression Level of Disease Section Compare with the Other Disease Section | p-value: 3.52E-01; Fold-change: 1.79E-01; Z-score: 7.47E-01 | |
|
Molecule expression in the normal tissue adjacent to the diseased tissue of patients
Molecule expression in the diseased tissue of patients
Molecule expression in the normal tissue of healthy individuals
Molecule expression in tissue other than the diseased tissue of patients
|
||
| Disease-specific Molecule Abundances |

|
Click to View the Clearer Original Diagram |
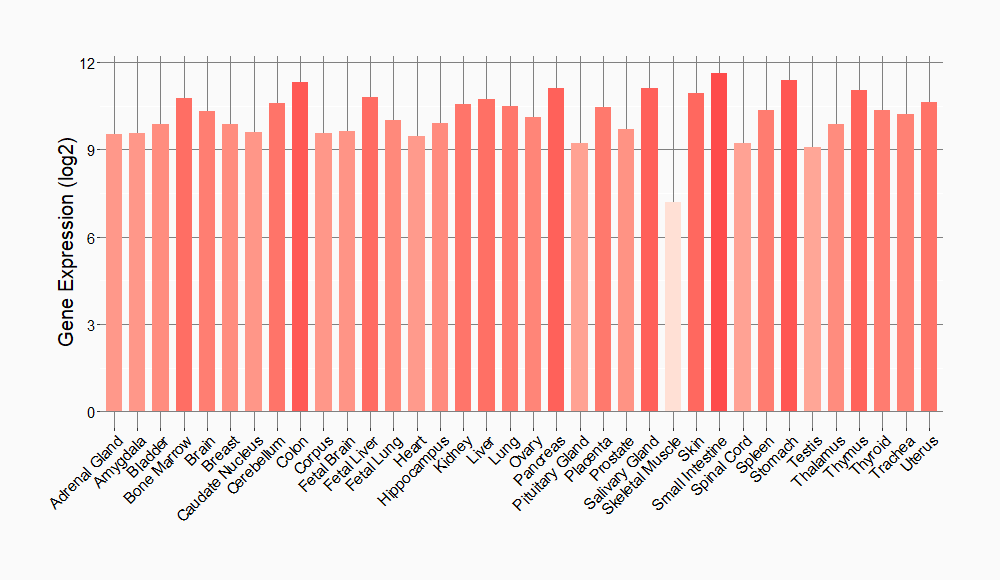
Tissue-specific Molecule Abundances in Healthy Individuals


|
||
References
If you find any error in data or bug in web service, please kindly report it to Dr. Sun and Dr. Yu.
