Molecule Information
General Information of the Molecule (ID: Mol00206)
| Name |
ATP-binding cassette sub-family F2 (ABCF2)
,Homo sapiens
|
||||
|---|---|---|---|---|---|
| Synonyms |
Iron-inhibited ABC transporter 2; HUSSY-18
Click to Show/Hide
|
||||
| Molecule Type |
Protein
|
||||
| Gene Name |
ABCF2
|
||||
| Gene ID | |||||
| Location |
chr7:151211484-151227205[-]
|
||||
| Sequence |
MPSDLAKKKAAKKKEAAKARQRPRKGHEENGDVVTEPQVAEKNEANGRETTEVDLLTKEL
EDFEMKKAAARAVTGVLASHPNSTDVHIINLSLTFHGQELLSDTKLELNSGRRYGLIGLN GIGKSMLLSAIGKREVPIPEHIDIYHLTREMPPSDKTPLHCVMEVDTERAMLEKEAERLA HEDAECEKLMELYERLEELDADKAEMRASRILHGLGFTPAMQRKKLKDFSGGWRMRVALA RALFIRPFMLLLDEPTNHLDLDACVWLEEELKTFKRILVLVSHSQDFLNGVCTNIIHMHN KKLKYYTGNYDQYVKTRLELEENQMKRFHWEQDQIAHMKNYIARFGHGSAKLARQAQSKE KTLQKMMASGLTERVVSDKTLSFYFPPCGKIPPPVIMVQNVSFKYTKDGPCIYNNLEFGI DLDTRVALVGPNGAGKSTLLKLLTGELLPTDGMIRKHSHVKIGRYHQHLQEQLDLDLSPL EYMMKCYPEIKEKEEMRKIIGRYGLTGKQQVSPIRNLSDGQKCRVCLAWLAWQNPHMLFL DEPTNHLDIETIDALADAINEFEGGMMLVSHDFRLIQQVAQEIWVCEKQTITKWPGDILA YKEHLKSKLVDEEPQLTKRTHNV Click to Show/Hide
|
||||
| Uniprot ID | |||||
| Ensembl ID | |||||
| HGNC ID | |||||
| Click to Show/Hide the Complete Species Lineage | |||||
Type(s) of Resistant Mechanism of This Molecule
Drug Resistance Data Categorized by Drug
Approved Drug(s)
2 drug(s) in total
| Drug Sensitivity Data Categorized by Their Corresponding Mechanisms | ||||
|
|
||||
| Disease Class: Ovarian cancer [ICD-11: 2C73.0] | [1] | |||
| Sensitive Disease | Ovarian cancer [ICD-11: 2C73.0] | |||
| Sensitive Drug | Cisplatin | |||
| Molecule Alteration | Expression | Down-regulation |
||
| Differential expression of the molecule in resistant disease | ||||
| Classification of Disease | Ovarian cancer [ICD-11: 2C73] | |||
| The Specified Disease | Ovarian cancer | |||
| The Studied Tissue | Ovarian tissue | |||
| The Expression Level of Disease Section Compare with the Healthy Individual Tissue | p-value: 6.49E-01 Fold-change: -1.38E-02 Z-score: -4.72E-01 |
|||
| Experimental Note | Revealed Based on the Cell Line Data | |||
| Cell Pathway Regulation | Cell colony | Inhibition | hsa05200 | |
| Cell viability | Inhibition | hsa05200 | ||
| In Vitro Model | SkOV3 cells | Ovary | Homo sapiens (Human) | CVCL_0532 |
| OVCA433 cells | Ovary | Homo sapiens (Human) | CVCL_0475 | |
| Experiment for Molecule Alteration |
Western blot analysis | |||
| Experiment for Drug Resistance |
MTT assay; colony-formation assay; Soft-agar colony-formation assay | |||
| Mechanism Description | miR-514 repressed proliferation and decreased cisplatin chemosensitivity in ovarian cancer cells by targeting ATP binding cassette subfamily. | |||
| Drug Sensitivity Data Categorized by Their Corresponding Mechanisms | ||||
|
|
||||
| Disease Class: Hepatocellular carcinoma [ICD-11: 2C12.2] | [2] | |||
| Sensitive Disease | Hepatocellular carcinoma [ICD-11: 2C12.2] | |||
| Sensitive Drug | Doxorubicin | |||
| Molecule Alteration | Expression | Down-regulation |
||
| Experimental Note | Revealed Based on the Cell Line Data | |||
| In Vitro Model | HepG2 cells | Liver | Homo sapiens (Human) | CVCL_0027 |
| Experiment for Molecule Alteration |
Western blot analysis | |||
| Experiment for Drug Resistance |
Flow Cytometric Analysis | |||
| Mechanism Description | Transfection of miR122 mimics into cultured HepG2 cells induces cell-cycle arrest and sensitizes these cells to doxorubicin by modulating the expression of multidrug resistance genes, ABCB1 and ABCF2. | |||
Disease- and Tissue-specific Abundances of This Molecule
ICD Disease Classification 02

| Differential expression of molecule in resistant diseases | ||
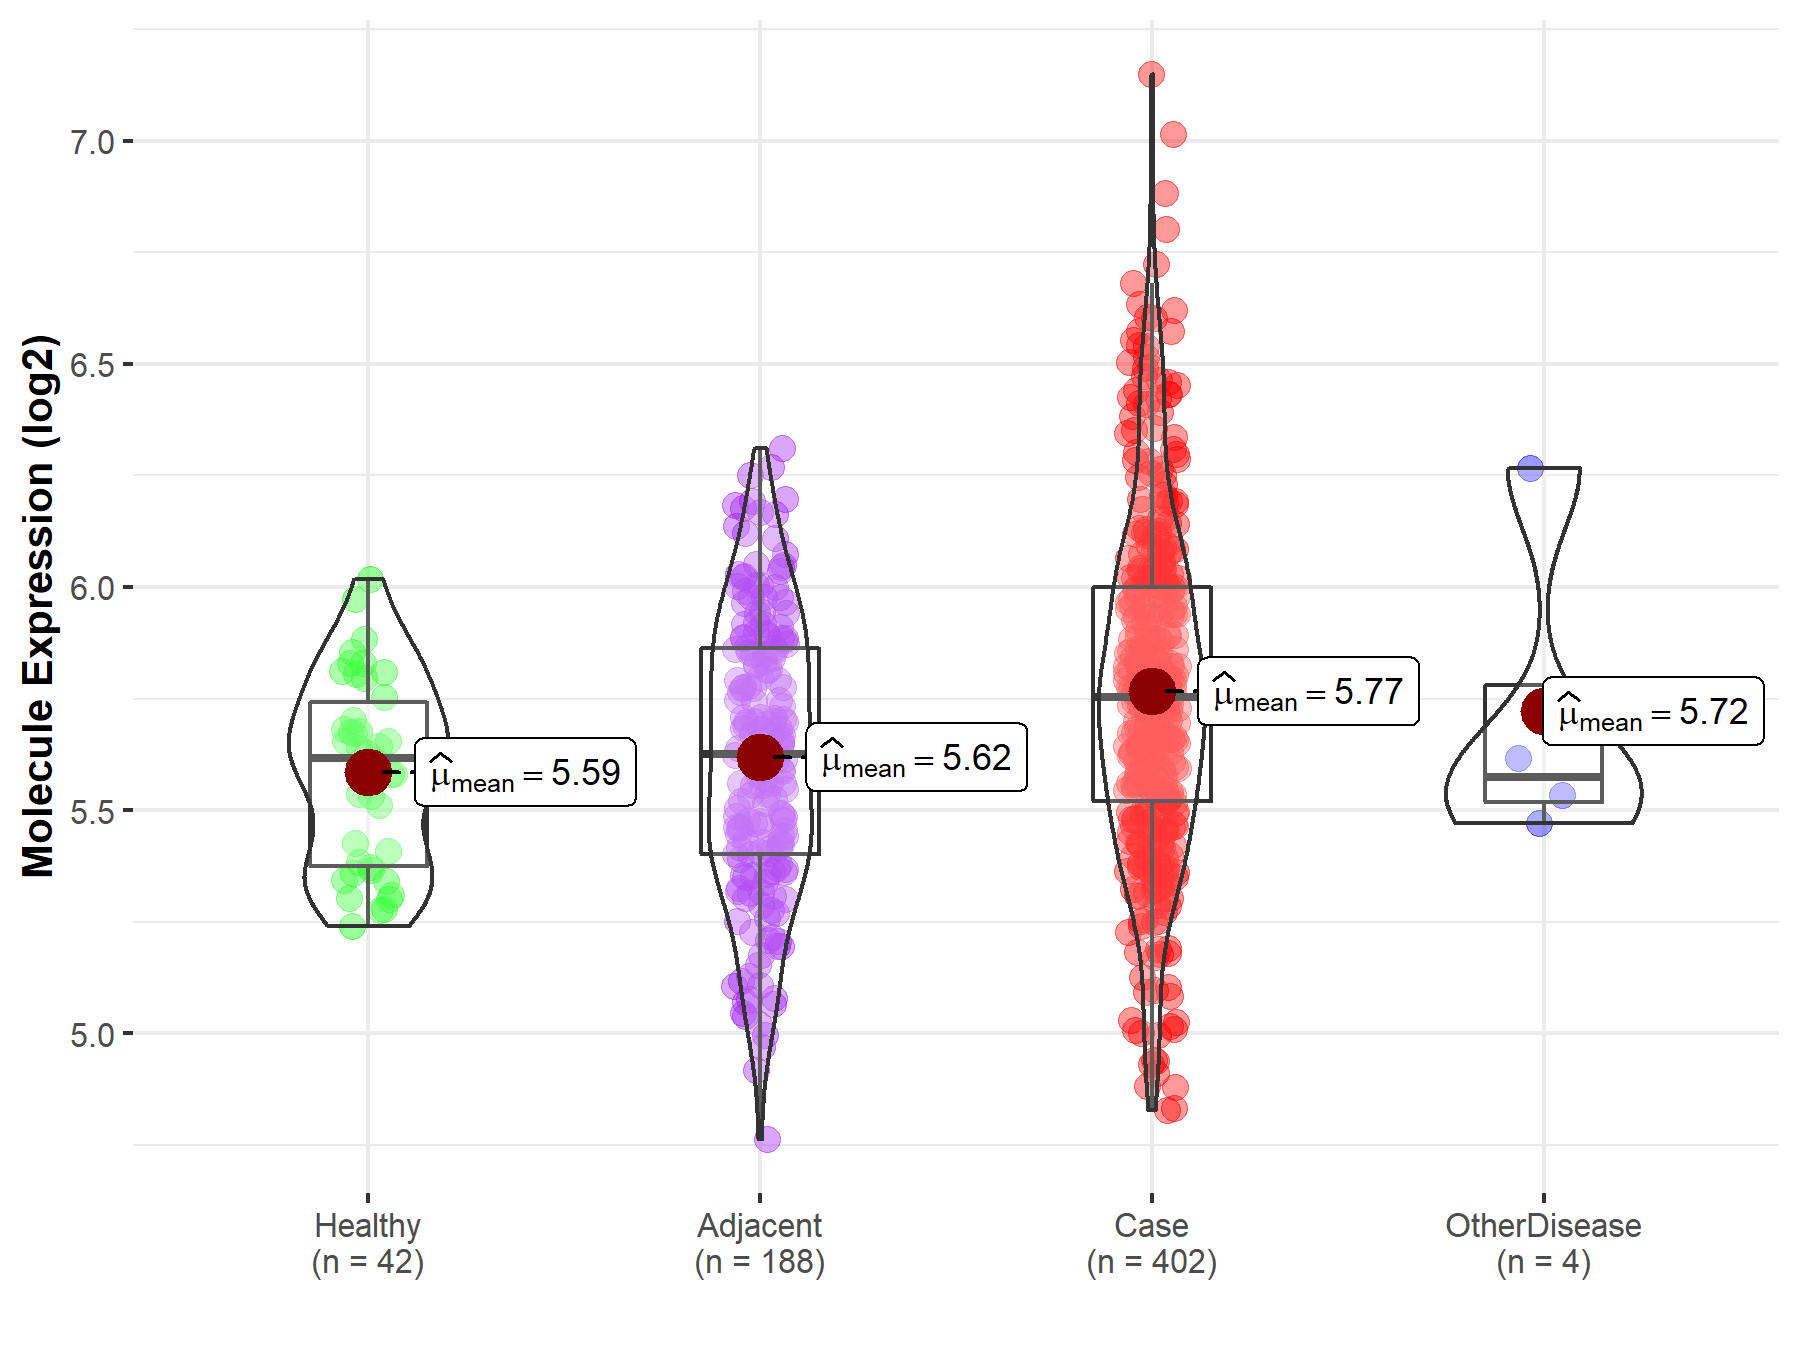
| The Studied Tissue | Liver | |
| The Specified Disease | Liver cancer | |
| The Expression Level of Disease Section Compare with the Healthy Individual Tissue | p-value: 8.70E-06; Fold-change: 1.35E-01; Z-score: 6.40E-01 | |
| The Expression Level of Disease Section Compare with the Adjacent Tissue | p-value: 1.33E-06; Fold-change: 1.27E-01; Z-score: 4.02E-01 | |
| The Expression Level of Disease Section Compare with the Other Disease Section | p-value: 8.26E-01; Fold-change: 1.77E-01; Z-score: 4.82E-01 | |
|
Molecule expression in the normal tissue adjacent to the diseased tissue of patients
Molecule expression in the diseased tissue of patients
Molecule expression in the normal tissue of healthy individuals
Molecule expression in tissue other than the diseased tissue of patients
|
||
| Disease-specific Molecule Abundances |

|
Click to View the Clearer Original Diagram |
| Differential expression of molecule in resistant diseases | ||
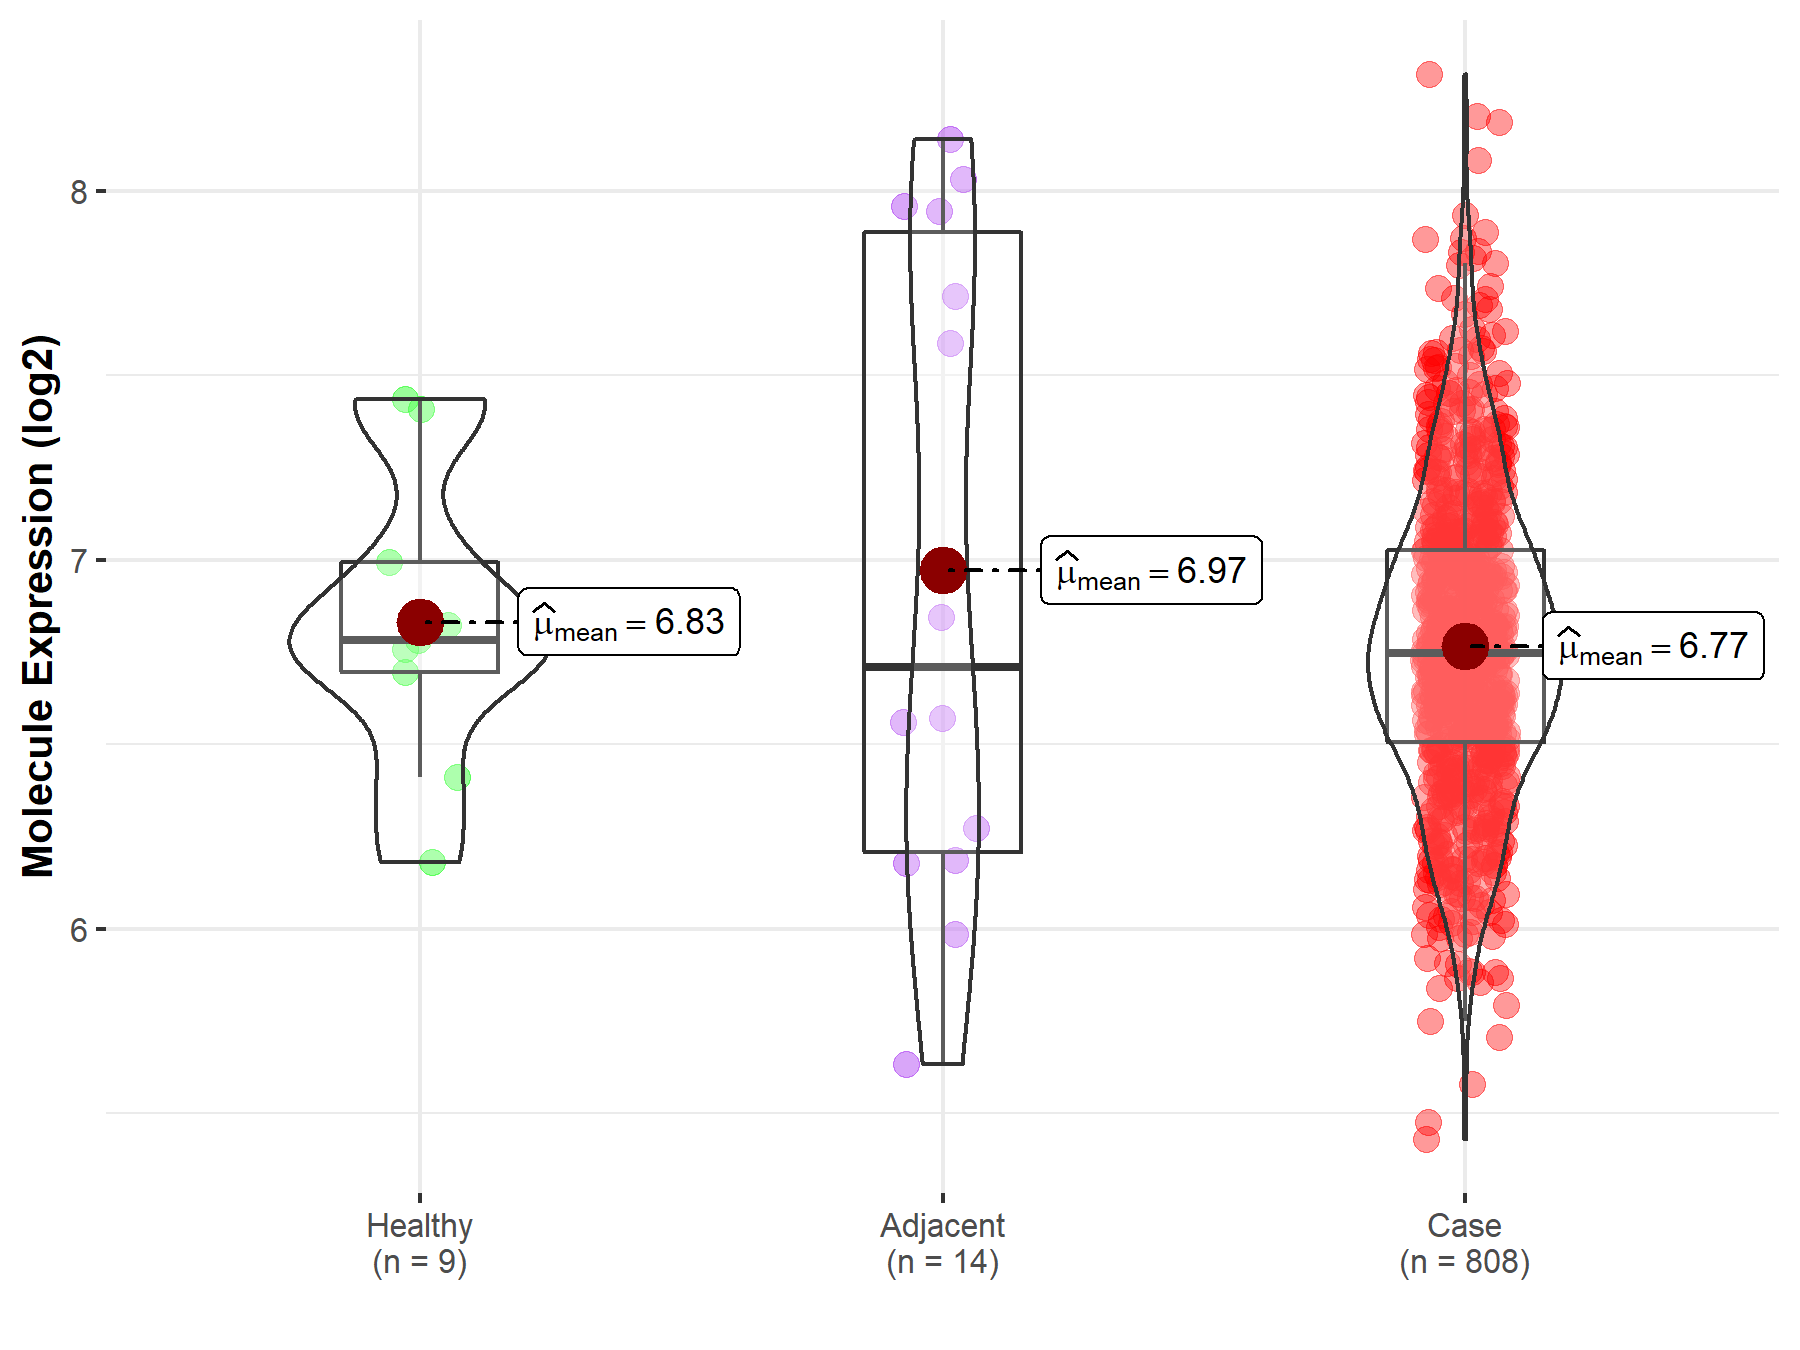
| The Studied Tissue | Ovary | |
| The Specified Disease | Ovarian cancer | |
| The Expression Level of Disease Section Compare with the Healthy Individual Tissue | p-value: 6.49E-01; Fold-change: -3.60E-02; Z-score: -8.76E-02 | |
| The Expression Level of Disease Section Compare with the Adjacent Tissue | p-value: 4.02E-01; Fold-change: 3.79E-02; Z-score: 4.28E-02 | |
|
Molecule expression in the normal tissue adjacent to the diseased tissue of patients
Molecule expression in the diseased tissue of patients
Molecule expression in the normal tissue of healthy individuals
|
||
| Disease-specific Molecule Abundances |

|
Click to View the Clearer Original Diagram |
Tissue-specific Molecule Abundances in Healthy Individuals


|
||
References
If you find any error in data or bug in web service, please kindly report it to Dr. Sun and Dr. Yu.
