Molecule Information
General Information of the Molecule (ID: Mol00172)
| Name |
Protein sprouty homolog 2 (SPRY2)
,Homo sapiens
|
||||
|---|---|---|---|---|---|
| Synonyms |
Spry-2
Click to Show/Hide
|
||||
| Molecule Type |
Protein
|
||||
| Gene Name |
SPRY2
|
||||
| Gene ID | |||||
| Location |
chr13:80335976-80341126[-]
|
||||
| Sequence |
MEARAQSGNGSQPLLQTPRDGGRQRGEPDPRDALTQQVHVLSLDQIRAIRNTNEYTEGPT
VVPRPGLKPAPRPSTQHKHERLHGLPEHRQPPRLQHSQVHSSARAPLSRSISTVSSGSRS STRTSTSSSSSEQRLLGSSFSSGPVADGIIRVQPKSELKPGELKPLSKEDLGLHAYRCED CGKCKCKECTYPRPLPSDWICDKQCLCSAQNVIDYGTCVCCVKGLFYHCSNDDEDNCADN PCSCSQSHCCTRWSAMGVMSLFLPCLWCYLPAKGCLKLCQGCYDRVNRPGCRCKNSNTVC CKVPTVPPRNFEKPT Click to Show/Hide
|
||||
| 3D-structure |
|
||||
| Function |
Antagonist of fibroblast growth factor (FGF) pathways via inhibition of FGF-mediated phosphorylation of ERK1/2. Thereby acts as an antagonist of FGF-induced retinal lens fiber differentiation, may inhibit limb bud outgrowth and may negatively modulate respiratory organogenesis. Inhibits TGFB-induced epithelial-to-mesenchymal transition in retinal lens epithelial cells. Inhibits CBL/C-CBL-mediated EGFR ubiquitination.
Click to Show/Hide
|
||||
| Uniprot ID | |||||
| Ensembl ID | |||||
| HGNC ID | |||||
| Click to Show/Hide the Complete Species Lineage | |||||
Type(s) of Resistant Mechanism of This Molecule
Drug Resistance Data Categorized by Drug
Approved Drug(s)
3 drug(s) in total
| Drug Resistance Data Categorized by Their Corresponding Mechanisms | ||||
|
|
||||
| Disease Class: Glioma [ICD-11: 2A00.1] | [1] | |||
| Resistant Disease | Glioma [ICD-11: 2A00.1] | |||
| Resistant Drug | Carmustine | |||
| Molecule Alteration | Expression | Down-regulation |
||
| Differential expression of the molecule in resistant disease | ||||
| Classification of Disease | Brain cancer [ICD-11: 2A00] | |||
| The Specified Disease | Glioma | |||
| The Studied Tissue | Nervous tissue | |||
| The Expression Level of Disease Section Compare with the Healthy Individual Tissue | p-value: 6.16E-06 Fold-change: -6.62E-01 Z-score: -5.92E+00 |
|||
| Experimental Note | Revealed Based on the Cell Line Data | |||
| In Vitro Model | SWOZ2 cells | Brain | Homo sapiens (Human) | N.A. |
| SWOZ2-BCNU cells | Brain | Homo sapiens (Human) | N.A. | |
| Experiment for Molecule Alteration |
Western blot analysis | |||
| Experiment for Drug Resistance |
CCK8 assay | |||
| Mechanism Description | miR21 enhanced glioma cells resistance to carmustine via decreasing Spry2 expression. | |||
| Drug Sensitivity Data Categorized by Their Corresponding Mechanisms | ||||
|
|
||||
| Disease Class: Osteosarcoma [ICD-11: 2B51.0] | [2] | |||
| Sensitive Disease | Osteosarcoma [ICD-11: 2B51.0] | |||
| Sensitive Drug | Cisplatin | |||
| Molecule Alteration | Expression | Down-regulation |
||
| Experimental Note | Revealed Based on the Cell Line Data | |||
| Cell Pathway Regulation | Cell proliferation | Activation | hsa05200 | |
| In Vitro Model | MG63 cells | Bone marrow | Homo sapiens (Human) | CVCL_0426 |
| SAOS-2 cells | Bone marrow | Homo sapiens (Human) | CVCL_0548 | |
| U2OS cells | Bone | Homo sapiens (Human) | CVCL_0042 | |
| HOS cells | Bone | Homo sapiens (Human) | CVCL_0312 | |
| 143B cells | Bone | Homo sapiens (Human) | CVCL_2270 | |
| HLNG cells | Bone marrow | Homo sapiens (Human) | N.A. | |
| Experiment for Molecule Alteration |
Northern blotting | |||
| Experiment for Drug Resistance |
Scratch assay | |||
| Mechanism Description | miR-21 regulatory network plays a role in tumorigenesis of osteosarcoma. Its expression facilitates cell proliferation and decreases cellular sensitivity towards cisplatin. Both effects can be rescued by Spry2, a target protein downregulated by increased miR-21 levels. | |||
| Drug Sensitivity Data Categorized by Their Corresponding Mechanisms | ||||
|
|
||||
| Disease Class: Prostate cancer [ICD-11: 2C82.0] | [3] | |||
| Sensitive Disease | Prostate cancer [ICD-11: 2C82.0] | |||
| Sensitive Drug | Docetaxel | |||
| Molecule Alteration | Expression | Up-regulation |
||
| Experimental Note | Identified from the Human Clinical Data | |||
| Cell Pathway Regulation | ERK signaling pathway | Regulation | N.A. | |
| RTK signaling pathway | Inhibition | hsa04015 | ||
| In Vitro Model | DU-145 cells | Prostate | Homo sapiens (Human) | CVCL_0105 |
| LNCaP cells | Prostate | Homo sapiens (Human) | CVCL_0395 | |
| PC3 cells | Prostate | Homo sapiens (Human) | CVCL_0035 | |
| RWPE-1 cells | Prostate | Homo sapiens (Human) | CVCL_3791 | |
| C4-2 cells | Prostate | Homo sapiens (Human) | CVCL_4782 | |
| Experiment for Molecule Alteration |
RT-PCR | |||
| Experiment for Drug Resistance |
MTT assay; Flow cytometer assay | |||
| Mechanism Description | SPRY2 is a direct downstream target of miR183 and can be negatively regulated by miR183 and is regarded as a negative regulator RTk signaling pathway, antagonizing cell migration and/or cellular differentiation occurring through the ERk signaling. CASC2 competes with SPRY2 for miR183 binding to rescue the expression of SPRY2 in PC cells, thus suppressing the cell proliferation and promoting the apoptosis of PC cells, finally enhancing PC cells chemo-sensitivity to docetaxel through SPRY2 downstream ERk signaling pathway. | |||
Disease- and Tissue-specific Abundances of This Molecule
ICD Disease Classification 02

| Differential expression of molecule in resistant diseases | ||
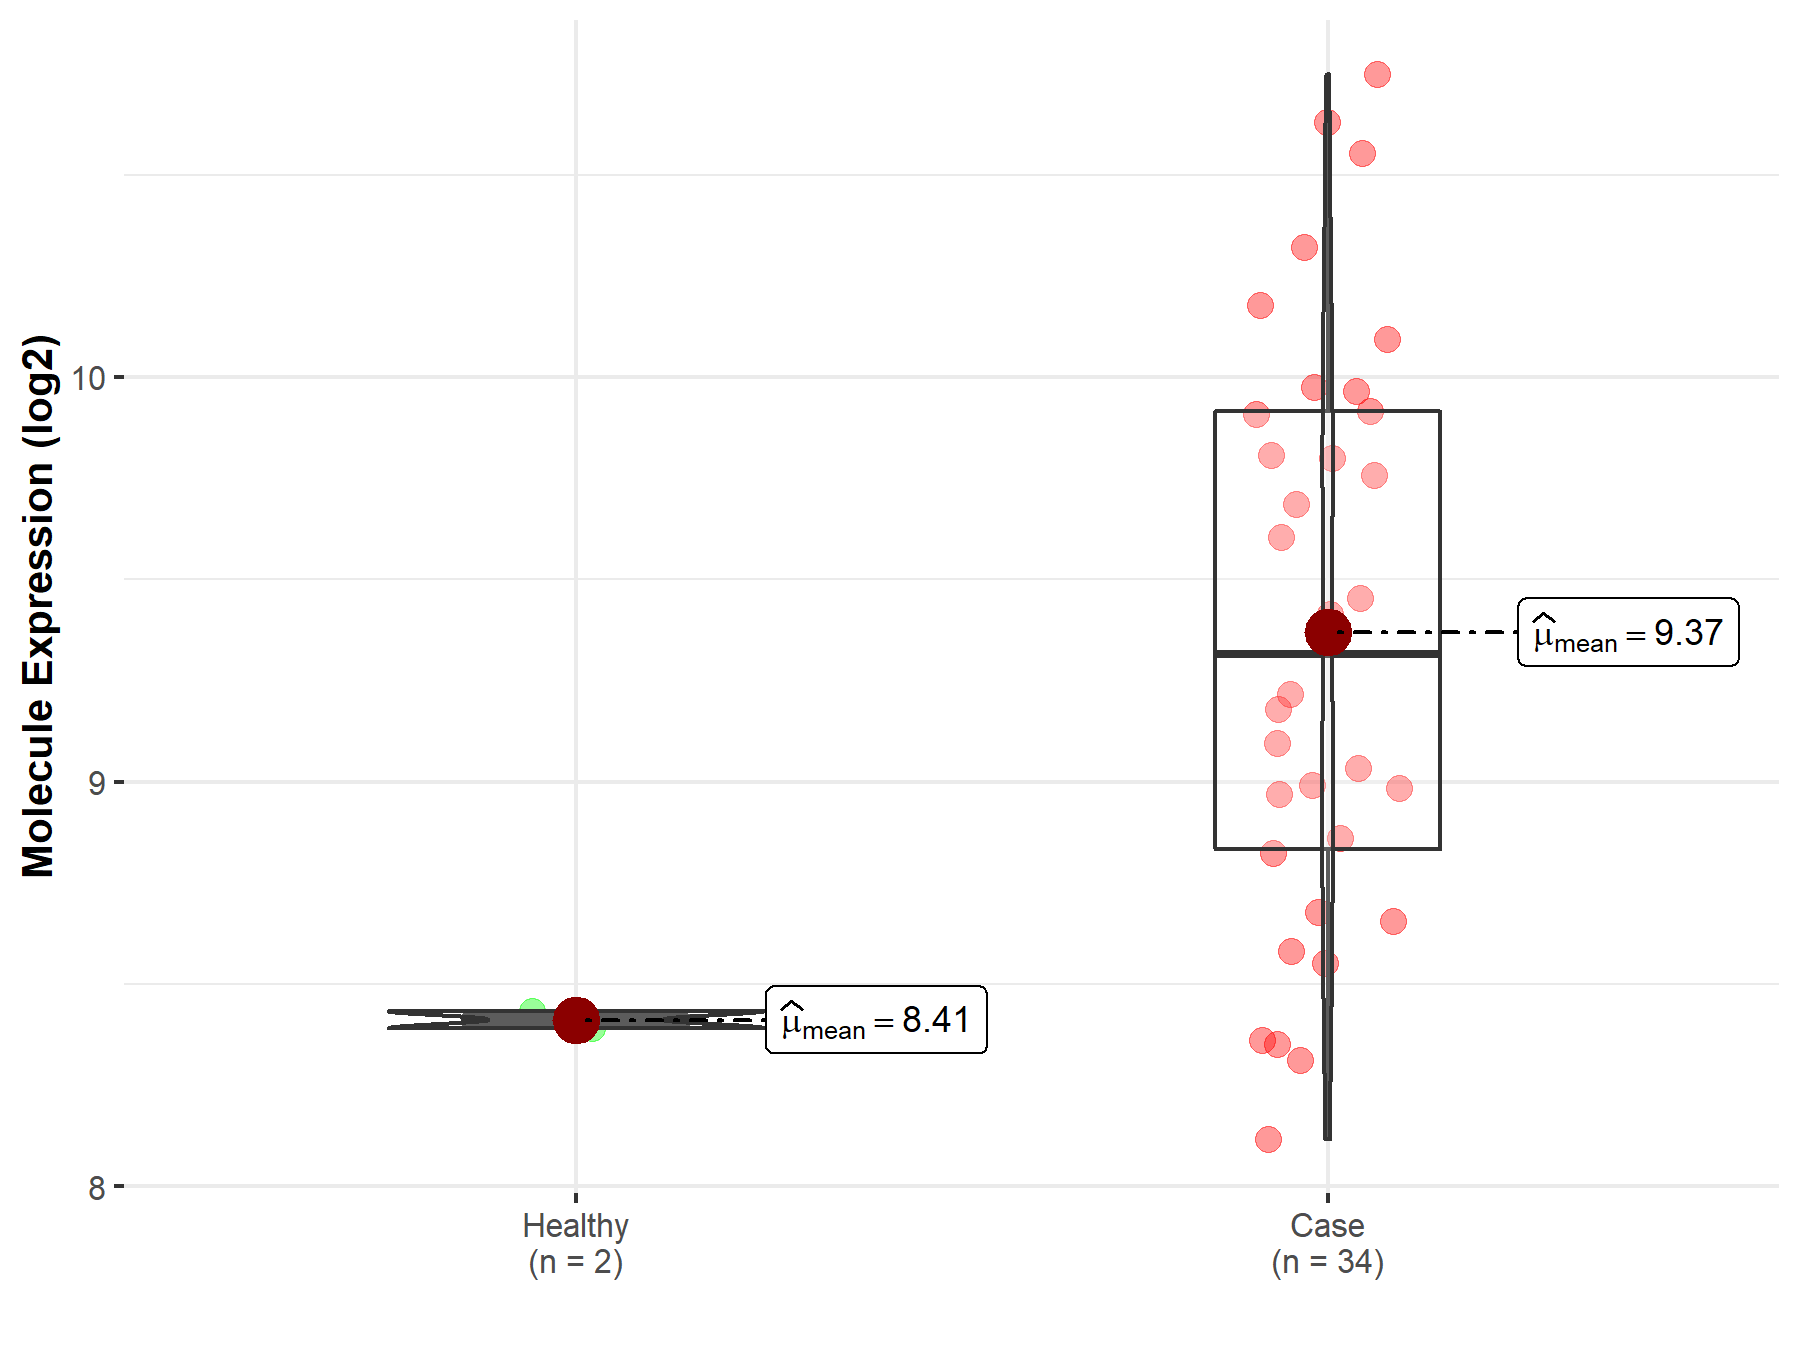
| The Studied Tissue | Nervous tissue | |
| The Specified Disease | Brain cancer | |
| The Expression Level of Disease Section Compare with the Healthy Individual Tissue | p-value: 2.47E-13; Fold-change: 4.09E-01; Z-score: 6.80E-01 | |
|
Molecule expression in the diseased tissue of patients
Molecule expression in the normal tissue of healthy individuals
|
||
| Disease-specific Molecule Abundances |

|
Click to View the Clearer Original Diagram |
| The Studied Tissue | Brainstem tissue | |
| The Specified Disease | Glioma | |
| The Expression Level of Disease Section Compare with the Healthy Individual Tissue | p-value: 7.74E-09; Fold-change: 9.03E-01; Z-score: 2.94E+01 | |
|
Molecule expression in the diseased tissue of patients
Molecule expression in the normal tissue of healthy individuals
|
||
| Disease-specific Molecule Abundances |

|
Click to View the Clearer Original Diagram |
| The Studied Tissue | White matter | |
| The Specified Disease | Glioma | |
| The Expression Level of Disease Section Compare with the Healthy Individual Tissue | p-value: 1.85E-02; Fold-change: 7.74E-01; Z-score: 1.36E+00 | |
|
Molecule expression in the diseased tissue of patients
Molecule expression in the normal tissue of healthy individuals
|
||
| Disease-specific Molecule Abundances |

|
Click to View the Clearer Original Diagram |
| The Studied Tissue | Brainstem tissue | |
| The Specified Disease | Neuroectodermal tumor | |
| The Expression Level of Disease Section Compare with the Healthy Individual Tissue | p-value: 1.29E-01; Fold-change: 2.87E-01; Z-score: 5.05E-01 | |
|
Molecule expression in the diseased tissue of patients
Molecule expression in the normal tissue of healthy individuals
|
||
| Disease-specific Molecule Abundances |

|
Click to View the Clearer Original Diagram |
| Differential expression of molecule in resistant diseases | ||
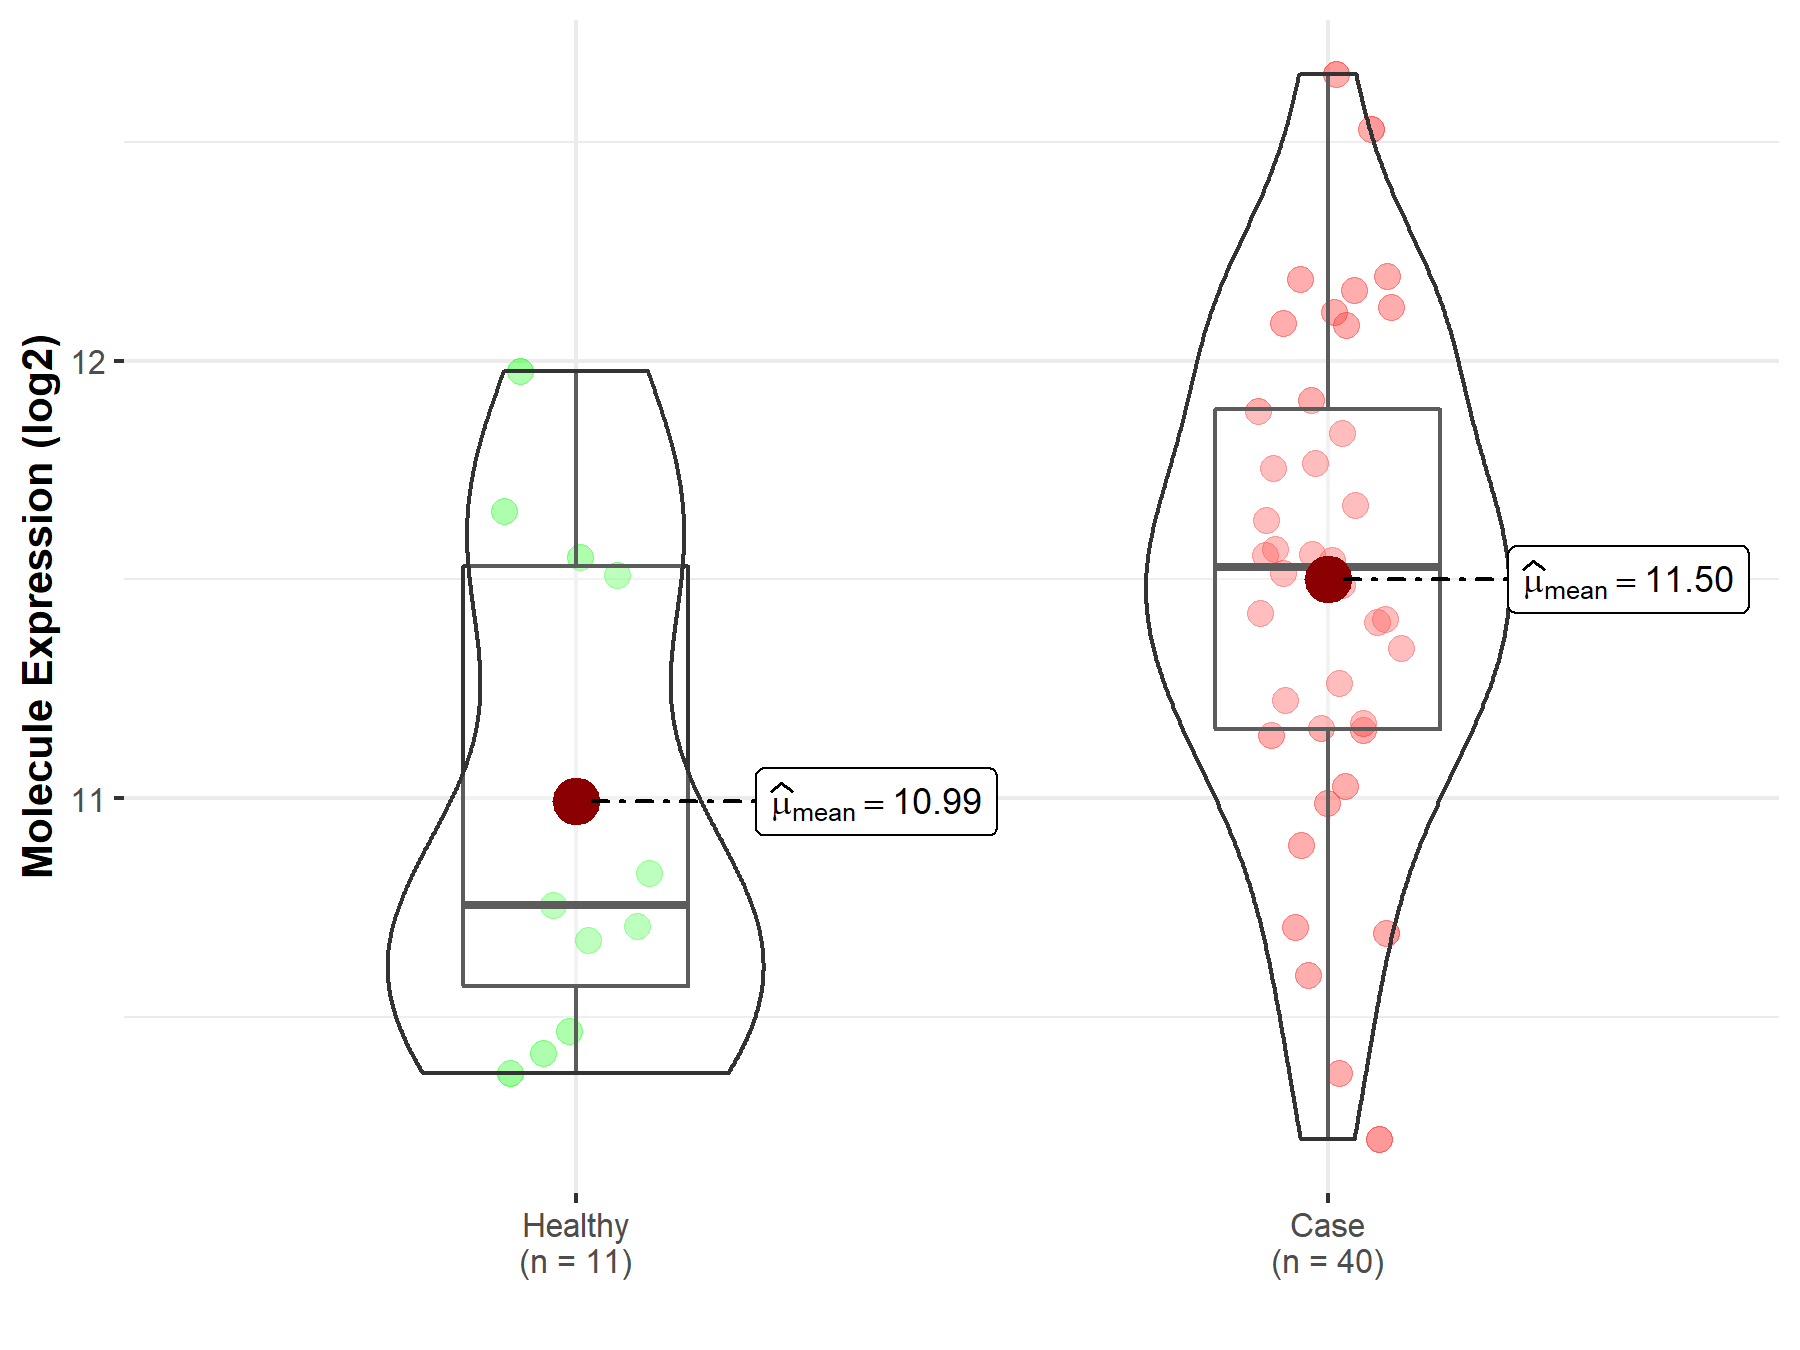
| The Studied Tissue | Prostate | |
| The Specified Disease | Prostate cancer | |
| The Expression Level of Disease Section Compare with the Healthy Individual Tissue | p-value: 1.64E-02; Fold-change: -1.35E-01; Z-score: -1.74E-01 | |
|
Molecule expression in the diseased tissue of patients
Molecule expression in the normal tissue of healthy individuals
|
||
| Disease-specific Molecule Abundances |

|
Click to View the Clearer Original Diagram |
Tissue-specific Molecule Abundances in Healthy Individuals


|
||
References
If you find any error in data or bug in web service, please kindly report it to Dr. Sun and Dr. Yu.
