Molecule Information
General Information of the Molecule (ID: Mol00164)
| Name |
Mothers against decapentaplegic homolog 4 (SMAD4)
,Homo sapiens
|
||||
|---|---|---|---|---|---|
| Synonyms |
MAD homolog 4; Mothers against DPP homolog 4; Deletion target in pancreatic carcinoma 4; SMAD family member 4; SMAD 4; Smad4; hSMAD4; DPC4; MADH4
Click to Show/Hide
|
||||
| Molecule Type |
Protein
|
||||
| Gene Name |
SMAD4
|
||||
| Gene ID | |||||
| Location |
chr18:51028394-51085045[+]
|
||||
| Sequence |
MDNMSITNTPTSNDACLSIVHSLMCHRQGGESETFAKRAIESLVKKLKEKKDELDSLITA
ITTNGAHPSKCVTIQRTLDGRLQVAGRKGFPHVIYARLWRWPDLHKNELKHVKYCQYAFD LKCDSVCVNPYHYERVVSPGIDLSGLTLQSNAPSSMMVKDEYVHDFEGQPSLSTEGHSIQ TIQHPPSNRASTETYSTPALLAPSESNATSTANFPNIPVASTSQPASILGGSHSEGLLQI ASGPQPGQQQNGFTGQPATYHHNSTTTWTGSRTAPYTPNLPHHQNGHLQHHPPMPPHPGH YWPVHNELAFQPPISNHPAPEYWCSIAYFEMDVQVGETFKVPSSCPIVTVDGYVDPSGGD RFCLGQLSNVHRTEAIERARLHIGKGVQLECKGEGDVWVRCLSDHAVFVQSYYLDREAGR APGDAVHKIYPSAYIKVFDLRQCHRQMQQQAATAQAAAAAQAAAVAGNIPGPGSVGGIAP AISLSAAAGIGVDDLRRLCILRMSFVKGWGPDYPRQSIKETPCWIEIHLHRALQLLDEVL HTMPIADPQPLD Click to Show/Hide
|
||||
| 3D-structure |
|
||||
| Function |
In muscle physiology, plays a central role in the balance between atrophy and hypertrophy. When recruited by MSTN, promotes atrophy response via phosphorylated SMAD2/4. MSTN decrease causes SMAD4 release and subsequent recruitment by the BMP pathway to promote hypertrophy via phosphorylated SMAD1/5/8. Acts synergistically with SMAD1 and YY1 in bone morphogenetic protein (BMP)-mediated cardiac-specific gene expression. Binds to SMAD binding elements (SBEs) (5'-GTCT/AGAC-3') within BMP response element (BMPRE) of cardiac activating regions. Common SMAD (co-SMAD) is the coactivator and mediator of signal transduction by TGF-beta (transforming growth factor). Component of the heterotrimeric SMAD2/SMAD3-SMAD4 complex that forms in the nucleus and is required for the TGF-mediated signaling. Promotes binding of the SMAD2/SMAD4/FAST-1 complex to DNA and provides an activation function required for SMAD1 or SMAD2 to stimulate transcription. Component of the multimeric SMAD3/SMAD4/JUN/FOS complex which forms at the AP1 promoter site; required for synergistic transcriptional activity in response to TGF-beta. May act as a tumor suppressor. Positively regulates PDPK1 kinase activity by stimulating its dissociation from the 14-3-3 protein YWHAQ which acts as a negative regulator.
Click to Show/Hide
|
||||
| Uniprot ID | |||||
| Ensembl ID | |||||
| HGNC ID | |||||
| Click to Show/Hide the Complete Species Lineage | |||||
Type(s) of Resistant Mechanism of This Molecule
 RTDM: Regulation by the Disease Microenvironment
 UAPP: Unusual Activation of Pro-survival Pathway
Drug Resistance Data Categorized by Drug
Approved Drug(s)
6 drug(s) in total
| Drug Sensitivity Data Categorized by Their Corresponding Mechanisms | ||||
|
Regulation by the Disease Microenvironment (RTDM)
|
||||
| Disease Class: Pancreatic cancer [ICD-11: 2C10.3] | [1] | |||
| Sensitive Disease | Pancreatic cancer [ICD-11: 2C10.3] | |||
| Sensitive Drug | Gemcitabine | |||
| Molecule Alteration | Expression | Down-regulation |
||
| Differential expression of the molecule in resistant disease | ||||
| Classification of Disease | Pancreatic cancer [ICD-11: 2C10] | |||
| The Specified Disease | Pancreatic cancer | |||
| The Studied Tissue | Pancreas | |||
| The Expression Level of Disease Section Compare with the Healthy Individual Tissue | p-value: 1.67E-03 Fold-change: -1.32E-01 Z-score: -3.22E+00 |
|||
| Experimental Note | Revealed Based on the Cell Line Data | |||
| Cell Pathway Regulation | Cell invasion | Inhibition | hsa05200 | |
| Cell migration | Inhibition | hsa04670 | ||
| Epithelial mesenchymal transition signaling pathway | Inhibition | hsa01521 | ||
| TGF-beta signaling pathway | Inhibition | hsa04350 | ||
| In Vitro Model | MDA-MB-231 cells | Breast | Homo sapiens (Human) | CVCL_0062 |
| BxPC-3 cells | Pancreas | Homo sapiens (Human) | CVCL_0186 | |
| Su.86.86 cells | Pancreas | Homo sapiens (Human) | CVCL_3881 | |
| CFPAC1 cells | Pancreas | Homo sapiens (Human) | CVCL_1119 | |
| KMP3 cells | Pancreas | Homo sapiens (Human) | CVCL_8491 | |
| KP4-4 cells | Pancreas | Homo sapiens (Human) | CVCL_Y142 | |
| Panc1 cells | Pancreas | Homo sapiens (Human) | CVCL_0480 | |
| Experiment for Molecule Alteration |
Western blot analysis | |||
| Experiment for Drug Resistance |
WST-8 assay; Crystal violet staining assay | |||
| Mechanism Description | Overexpression of miR509-5p and miR1243 increased the expression of E-cadherin through the suppression of EMT-related gene expression and that drug sensitivity increased with a combination of each of these miRNAs and gemcitabine. miR1243 directly regulated SMAD2 and SMAD4, which regulate the TGF-beta signaling pathway, resulting in an induction of the MET phenotype. Suppressing SMADs reduced the effect of TGF-beta. | |||
| Drug Resistance Data Categorized by Their Corresponding Mechanisms | ||||
|
Unusual Activation of Pro-survival Pathway (UAPP)
|
||||
| Disease Class: Colon cancer [ICD-11: 2B90.1] | [2] | |||
| Resistant Disease | Colon cancer [ICD-11: 2B90.1] | |||
| Resistant Drug | Oxaliplatin | |||
| Molecule Alteration | Expression | Down-regulation |
||
| Differential expression of the molecule in resistant disease | ||||
| Classification of Disease | Colon cancer [ICD-11: 2B90] | |||
| The Specified Disease | Colon cancer | |||
| The Studied Tissue | Colon tissue | |||
| The Expression Level of Disease Section Compare with the Healthy Individual Tissue | p-value: 1.42E-04 Fold-change: -4.75E-02 Z-score: -3.85E+00 |
|||
| Experimental Note | Identified from the Human Clinical Data | |||
| Cell Pathway Regulation | Cell proliferation | Activation | hsa05200 | |
| In Vitro Model | SW480 cells | Colon | Homo sapiens (Human) | CVCL_0546 |
| DLD1 cells | Colon | Homo sapiens (Human) | CVCL_0248 | |
| SW620 cells | Colon | Homo sapiens (Human) | CVCL_0547 | |
| CaCo2 cells | Colon | Homo sapiens (Human) | CVCL_0025 | |
| HCT116 cells | Colon | Homo sapiens (Human) | CVCL_0291 | |
| LOVO cells | Colon | Homo sapiens (Human) | CVCL_0399 | |
| RkO cells | Colon | Homo sapiens (Human) | CVCL_0504 | |
| HT-29 cells | Colon | Homo sapiens (Human) | CVCL_0320 | |
| NCM460 cells | Colon | Homo sapiens (Human) | CVCL_0460 | |
| In Vivo Model | Nude mouse xenograft model | Mus musculus | ||
| Experiment for Molecule Alteration |
Luciferase reporter assay; Western blot analysis | |||
| Experiment for Drug Resistance |
Annexin V-PE and 7-AAD double staining method to examine cell viabilityNA; CCK8 assay; Flow cytometric analysis | |||
| Mechanism Description | miR19b-3p promotes colon cancer proliferation and oxaliplatin-based chemoresistance by targeting SMAD4. | |||
| Drug Resistance Data Categorized by Their Corresponding Mechanisms | ||||
|
Unusual Activation of Pro-survival Pathway (UAPP)
|
||||
| Disease Class: Ovarian cancer [ICD-11: 2C73.0] | [3] | |||
| Resistant Disease | Ovarian cancer [ICD-11: 2C73.0] | |||
| Resistant Drug | Cisplatin | |||
| Molecule Alteration | Expression | Down-regulation |
||
| Differential expression of the molecule in resistant disease | ||||
| Classification of Disease | Ovarian cancer [ICD-11: 2C73] | |||
| The Specified Disease | Ovarian cancer | |||
| The Studied Tissue | Ovarian tissue | |||
| The Expression Level of Disease Section Compare with the Healthy Individual Tissue | p-value: 5.19E-03 Fold-change: -2.65E-01 Z-score: -3.77E+00 |
|||
| Experimental Note | Revealed Based on the Cell Line Data | |||
| Cell Pathway Regulation | Cell apoptosis | Inhibition | hsa04210 | |
| Cell proliferation | Activation | hsa05200 | ||
| In Vitro Model | A2780/DDP cells | Ovary | Homo sapiens (Human) | CVCL_D619 |
| SkOV-3/DDP cells | Ovary | Homo sapiens (Human) | CVCL_UI88 | |
| Experiment for Molecule Alteration |
Western blot analysis | |||
| Experiment for Drug Resistance |
CCK8 assay; Flow cytometry assay | |||
| Mechanism Description | PVT1 was overexpressed in tumor tissues of cisplatin-resistant patients comparing to cisplatin-sensitive patients. PVT1 knockdown significantly lowered cell viability and increased the percentage of apoptotic tumor cells in SkOV-3/DDP and A2780/DDP cells transfected with siPVT1 and treated with cisplatin. It manifested PVT1 knockdown can reverses the cisplatin resistance in cisplatin-resistant cell lines. | |||
| Drug Resistance Data Categorized by Their Corresponding Mechanisms | ||||
|
Regulation by the Disease Microenvironment (RTDM)
|
||||
| Disease Class: Prolactinomas [ICD-11: 2F37.2] | [4] | |||
| Resistant Disease | Prolactinomas [ICD-11: 2F37.2] | |||
| Resistant Drug | Bromocriptine | |||
| Molecule Alteration | Expression | Up-regulation |
||
| Experimental Note | Identified from the Human Clinical Data | |||
| Cell Pathway Regulation | TGF-beta 1/Smad3 pathway | Activation | hsa04350 | |
| In Vitro Model | HS27 cells | Bone | Homo sapiens (Human) | CVCL_0E34 |
| MMQ cells | Pituitary gland | Rattus norvegicus (Rat) | CVCL_2117 | |
| Experiment for Molecule Alteration |
Western blotting assay | |||
| Experiment for Drug Resistance |
CCK8 assay | |||
| Mechanism Description | TGF-beta1 promotes the synthesis and secretion of collagen fibers in fibroblasts and that the TGF-beta1/Smad3 pathway is involved in the mechanism of prolactinoma resistance by increasing fibrosis through interactions with fibroblasts. | |||
| Drug Resistance Data Categorized by Their Corresponding Mechanisms | ||||
|
Unusual Activation of Pro-survival Pathway (UAPP)
|
||||
| Disease Class: Breast cancer [ICD-11: 2C60.3] | [5] | |||
| Resistant Disease | Breast cancer [ICD-11: 2C60.3] | |||
| Resistant Drug | Doxorubicin | |||
| Molecule Alteration | Expression | Down-regulation |
||
| Experimental Note | Revealed Based on the Cell Line Data | |||
| Cell Pathway Regulation | Cell apoptosis | Activation | hsa04210 | |
| Cell proliferation | Activation | hsa05200 | ||
| Cell viability | Inhibition | hsa05200 | ||
| In Vitro Model | MCF-7 cells | Breast | Homo sapiens (Human) | CVCL_0031 |
| MCF-7/ADR cells | Breast | Homo sapiens (Human) | CVCL_1452 | |
| Experiment for Molecule Alteration |
Western blot analysis | |||
| Experiment for Drug Resistance |
MTT assay; Flow cytometry assay | |||
| Mechanism Description | microRNA-574 enhances doxorubicin resistance through down-regulating SMAD4 in breast cancer cells. | |||
| Drug Resistance Data Categorized by Their Corresponding Mechanisms | ||||
|
Unusual Activation of Pro-survival Pathway (UAPP)
|
||||
| Disease Class: Hepatocellular carcinoma [ICD-11: 2C12.2] | [6] | |||
| Resistant Disease | Hepatocellular carcinoma [ICD-11: 2C12.2] | |||
| Resistant Drug | IFN-alpha | |||
| Molecule Alteration | Expression | Down-regulation |
||
| Experimental Note | Revealed Based on the Cell Line Data | |||
| Cell Pathway Regulation | Wnt/Beta signaling pathway | Activation | hsa04310 | |
| In Vitro Model | PLC/PRF/5 cells | Liver | Homo sapiens (Human) | CVCL_0485 |
| Experiment for Molecule Alteration |
Western blot analysis | |||
| Experiment for Drug Resistance |
MTT assay | |||
| Mechanism Description | miR-146a confers resistance to IFN-alpha in HCC cells by inhibiting apoptosis through SMAD4. | |||
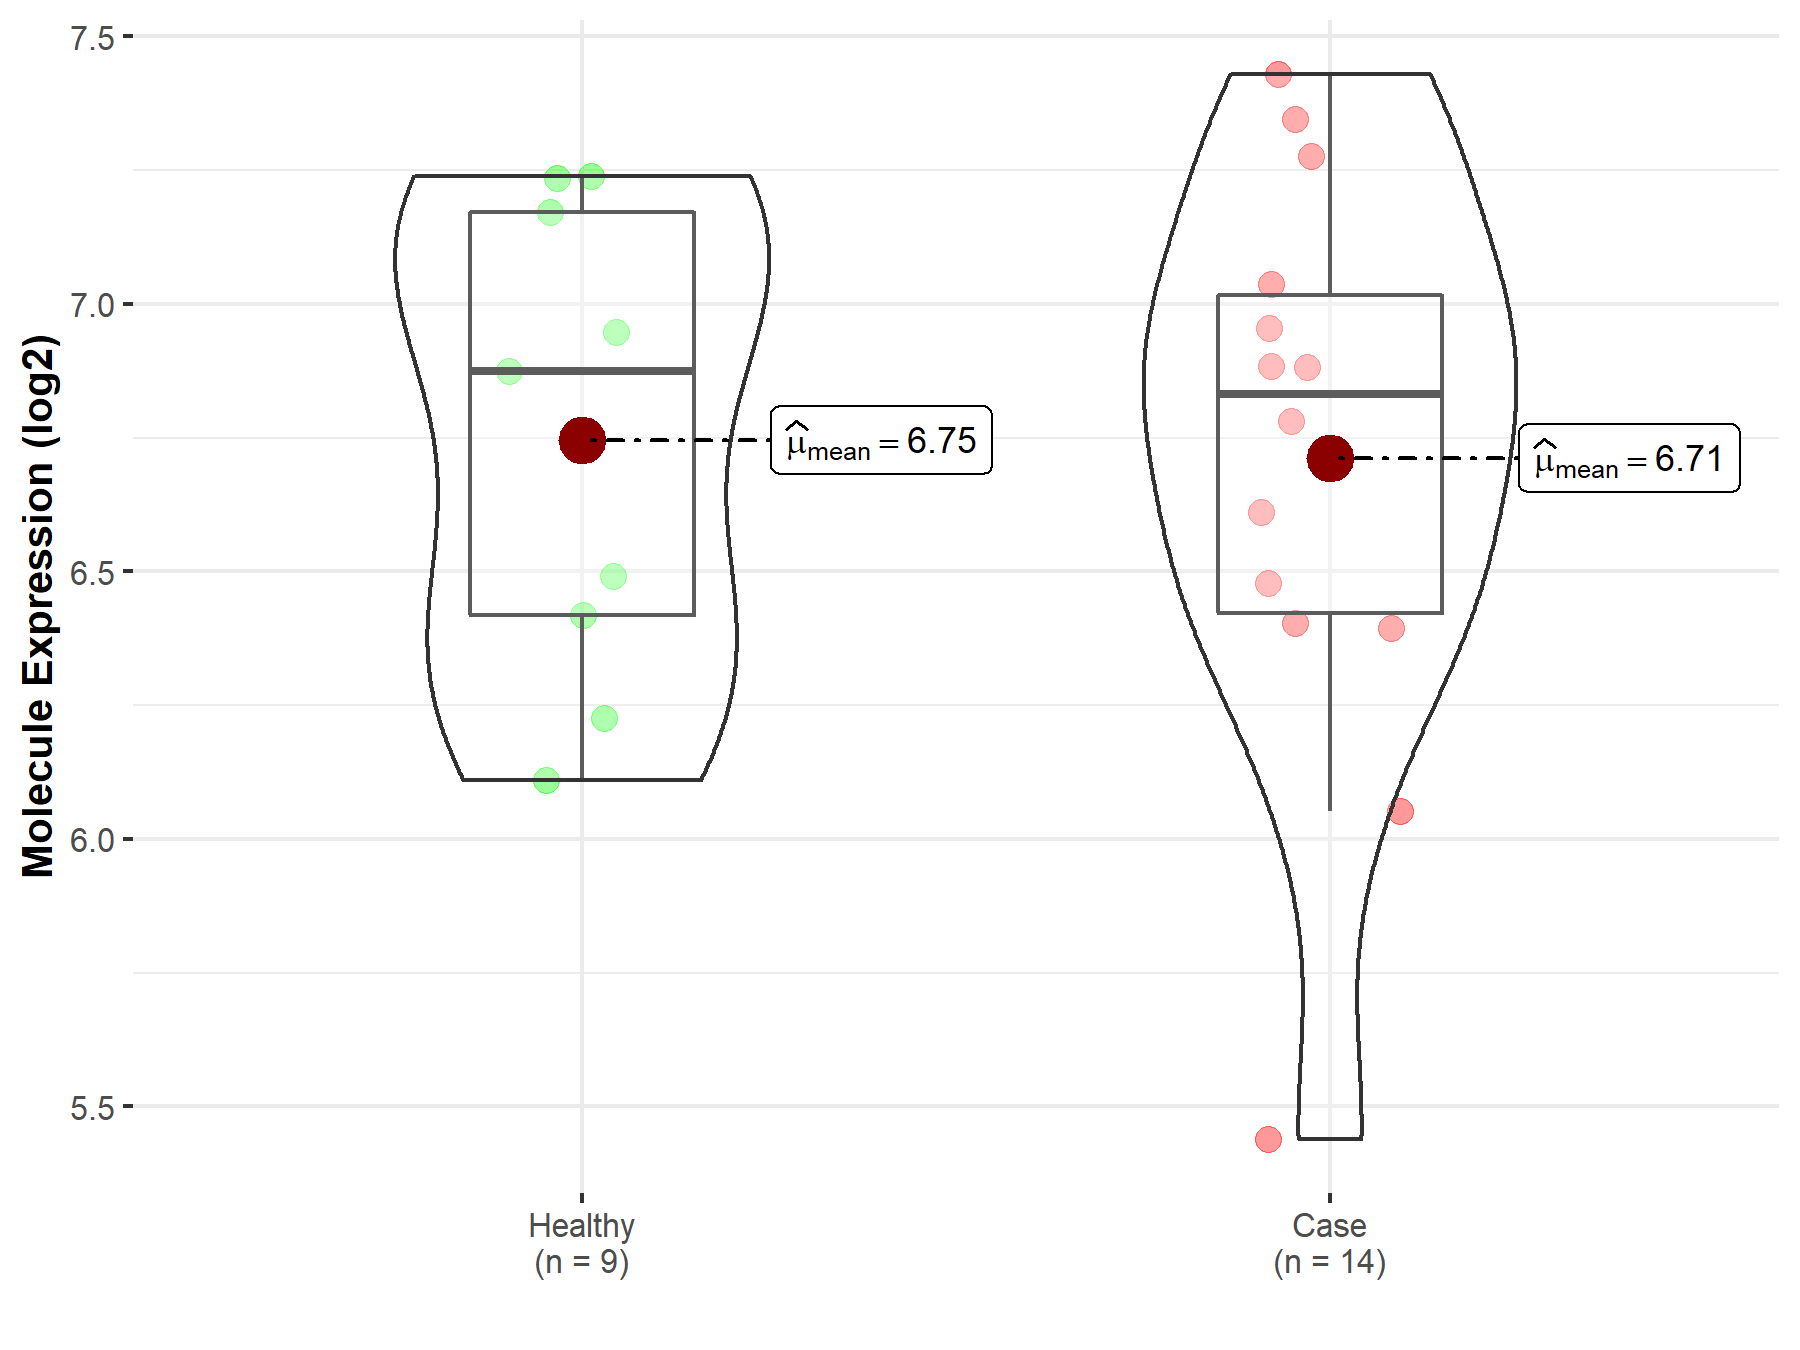
Disease- and Tissue-specific Abundances of This Molecule
ICD Disease Classification 02

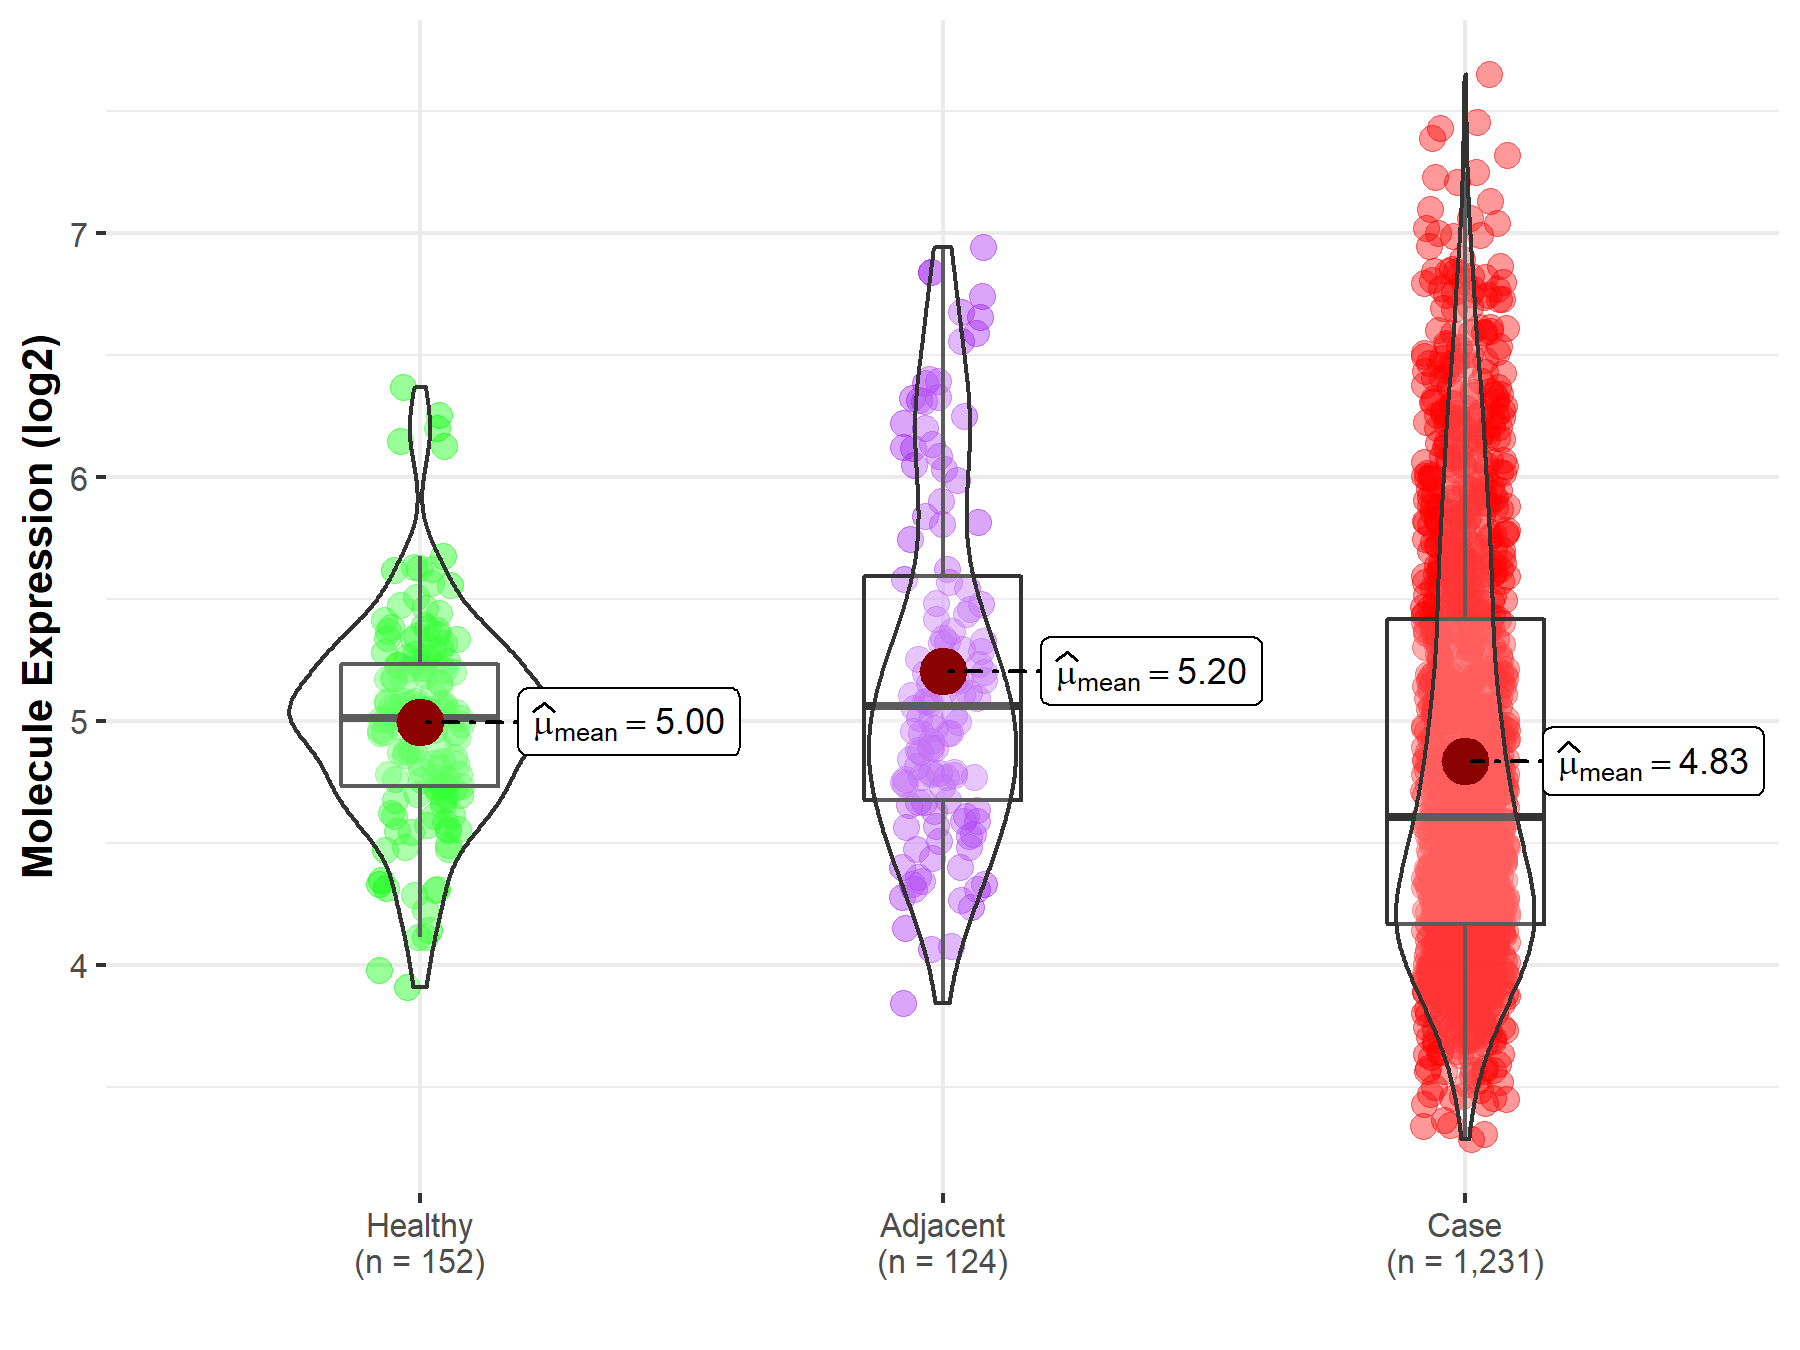
| Differential expression of molecule in resistant diseases | ||
| The Studied Tissue | Colon | |
| The Specified Disease | Colon cancer | |
| The Expression Level of Disease Section Compare with the Healthy Individual Tissue | p-value: 1.42E-04; Fold-change: -4.09E-01; Z-score: -9.72E-01 | |
| The Expression Level of Disease Section Compare with the Adjacent Tissue | p-value: 3.08E-07; Fold-change: -4.59E-01; Z-score: -6.36E-01 | |
|
Molecule expression in the normal tissue adjacent to the diseased tissue of patients
Molecule expression in the diseased tissue of patients
Molecule expression in the normal tissue of healthy individuals
|
||
| Disease-specific Molecule Abundances |
|
Click to View the Clearer Original Diagram |
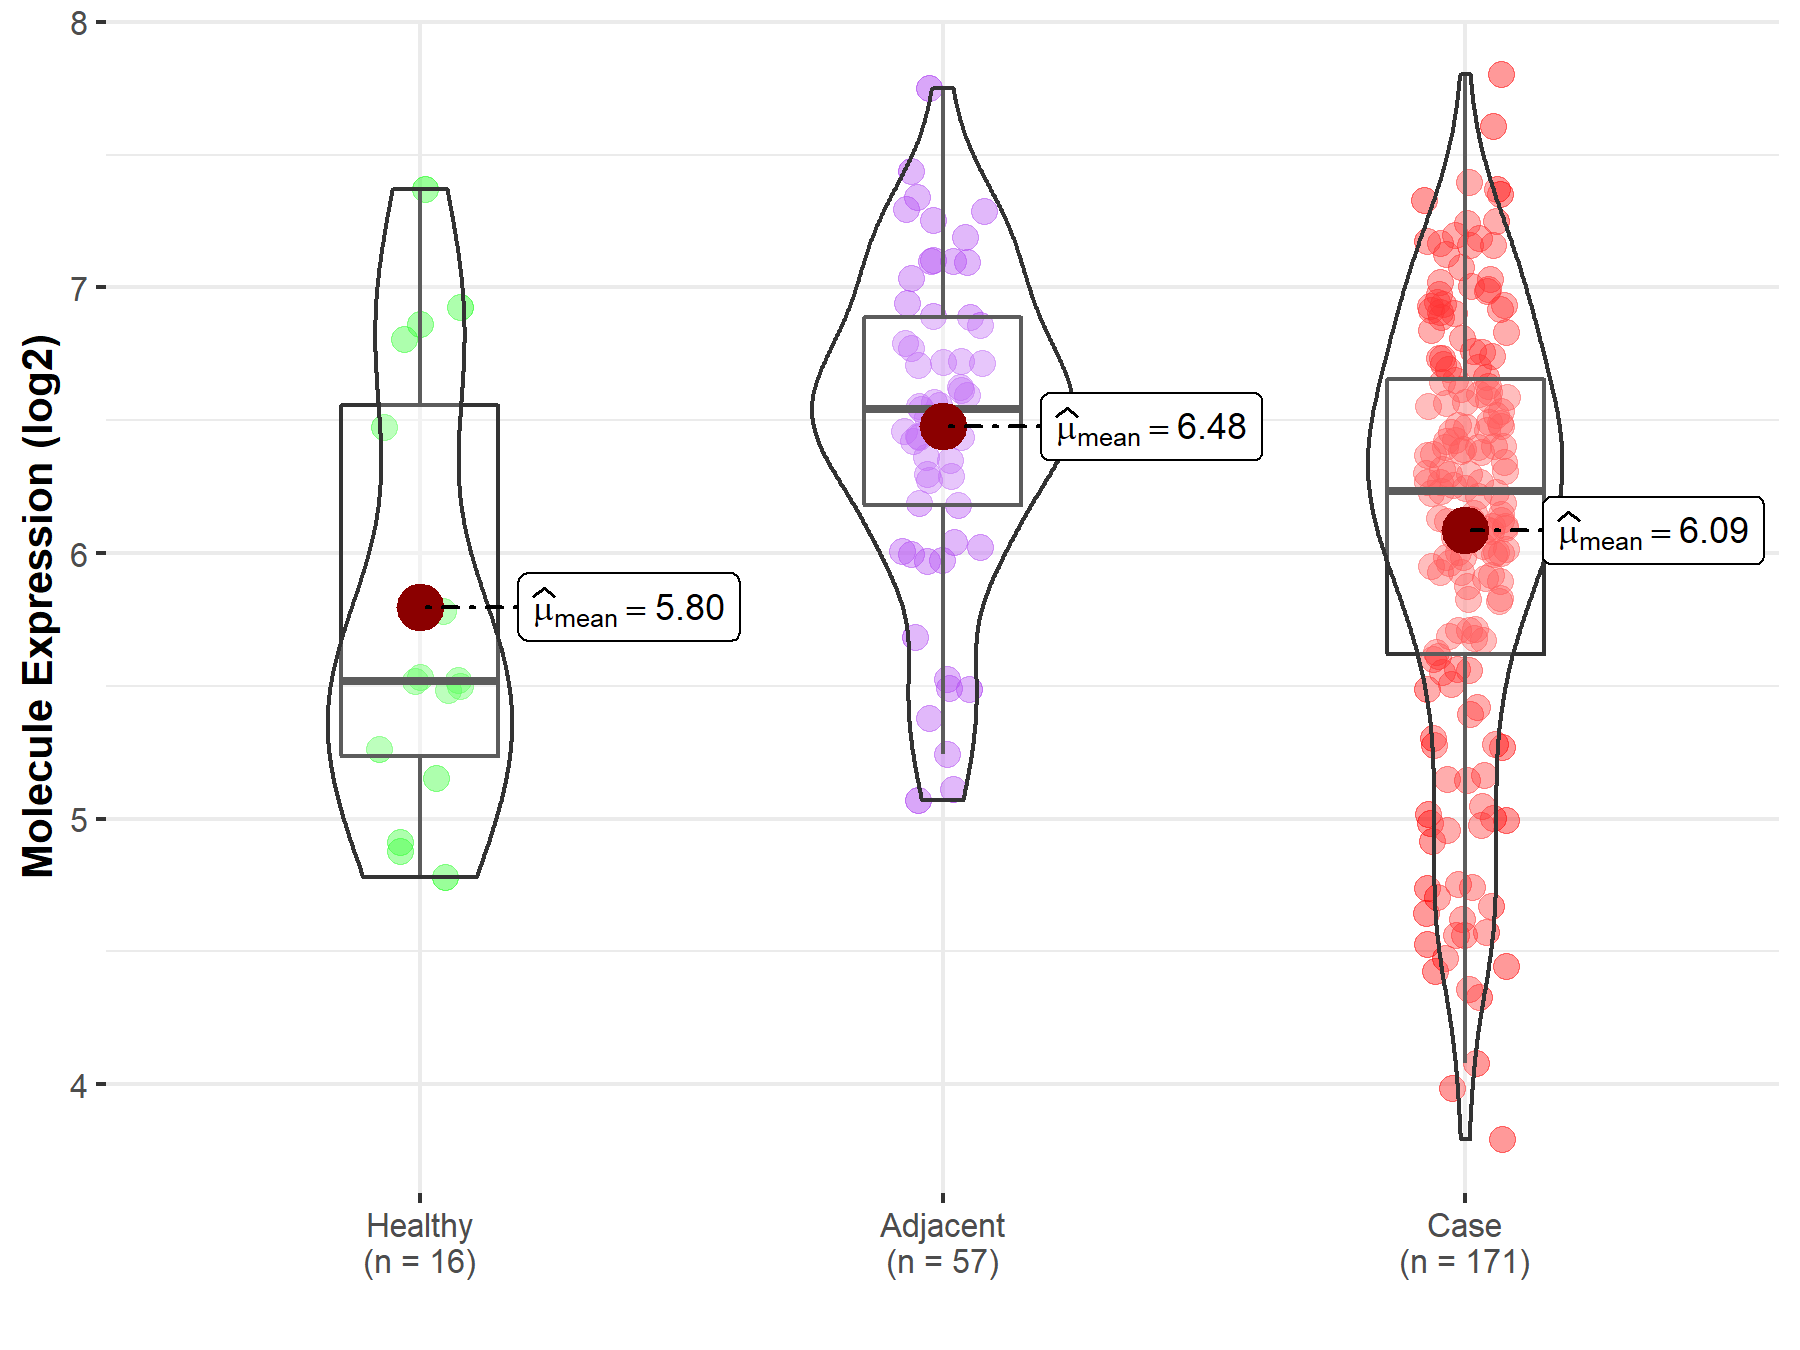
| Differential expression of molecule in resistant diseases | ||
| The Studied Tissue | Pancreas | |
| The Specified Disease | Pancreatic cancer | |
| The Expression Level of Disease Section Compare with the Healthy Individual Tissue | p-value: 1.97E-01; Fold-change: 7.12E-01; Z-score: 8.66E-01 | |
| The Expression Level of Disease Section Compare with the Adjacent Tissue | p-value: 1.99E-04; Fold-change: -3.10E-01; Z-score: -5.12E-01 | |
|
Molecule expression in the normal tissue adjacent to the diseased tissue of patients
Molecule expression in the diseased tissue of patients
Molecule expression in the normal tissue of healthy individuals
|
||
| Disease-specific Molecule Abundances |
|
Click to View the Clearer Original Diagram |
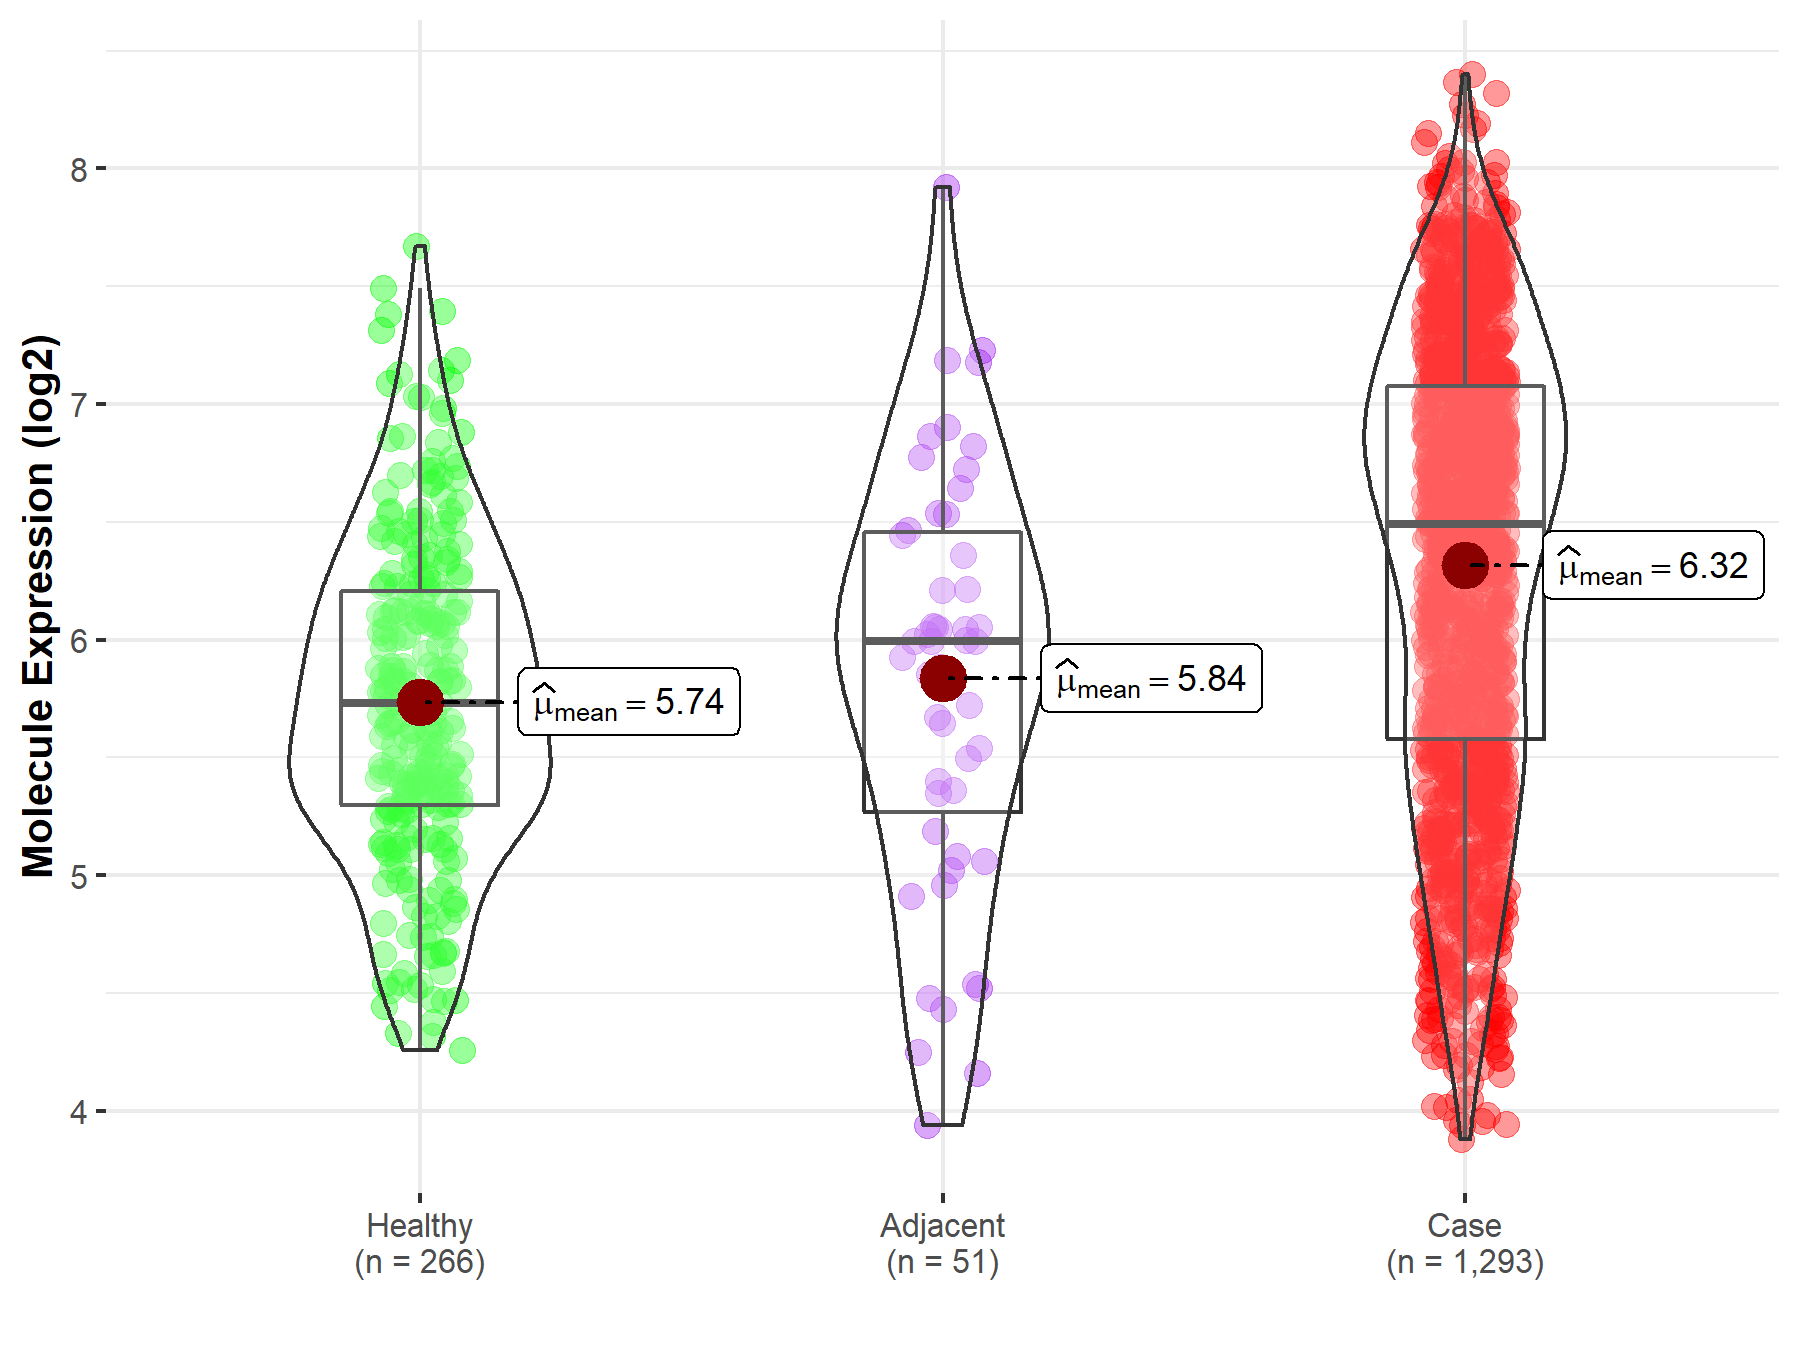
| Differential expression of molecule in resistant diseases | ||
| The Studied Tissue | Liver | |
| The Specified Disease | Liver cancer | |
| The Expression Level of Disease Section Compare with the Healthy Individual Tissue | p-value: 6.71E-02; Fold-change: 1.14E-01; Z-score: 1.60E-01 | |
| The Expression Level of Disease Section Compare with the Adjacent Tissue | p-value: 1.67E-03; Fold-change: -4.53E-01; Z-score: -5.29E-01 | |
| The Expression Level of Disease Section Compare with the Other Disease Section | p-value: 4.53E-01; Fold-change: -3.38E-01; Z-score: -4.31E-01 | |
|
Molecule expression in the normal tissue adjacent to the diseased tissue of patients
Molecule expression in the diseased tissue of patients
Molecule expression in the normal tissue of healthy individuals
Molecule expression in tissue other than the diseased tissue of patients
|
||
| Disease-specific Molecule Abundances |

|
Click to View the Clearer Original Diagram |
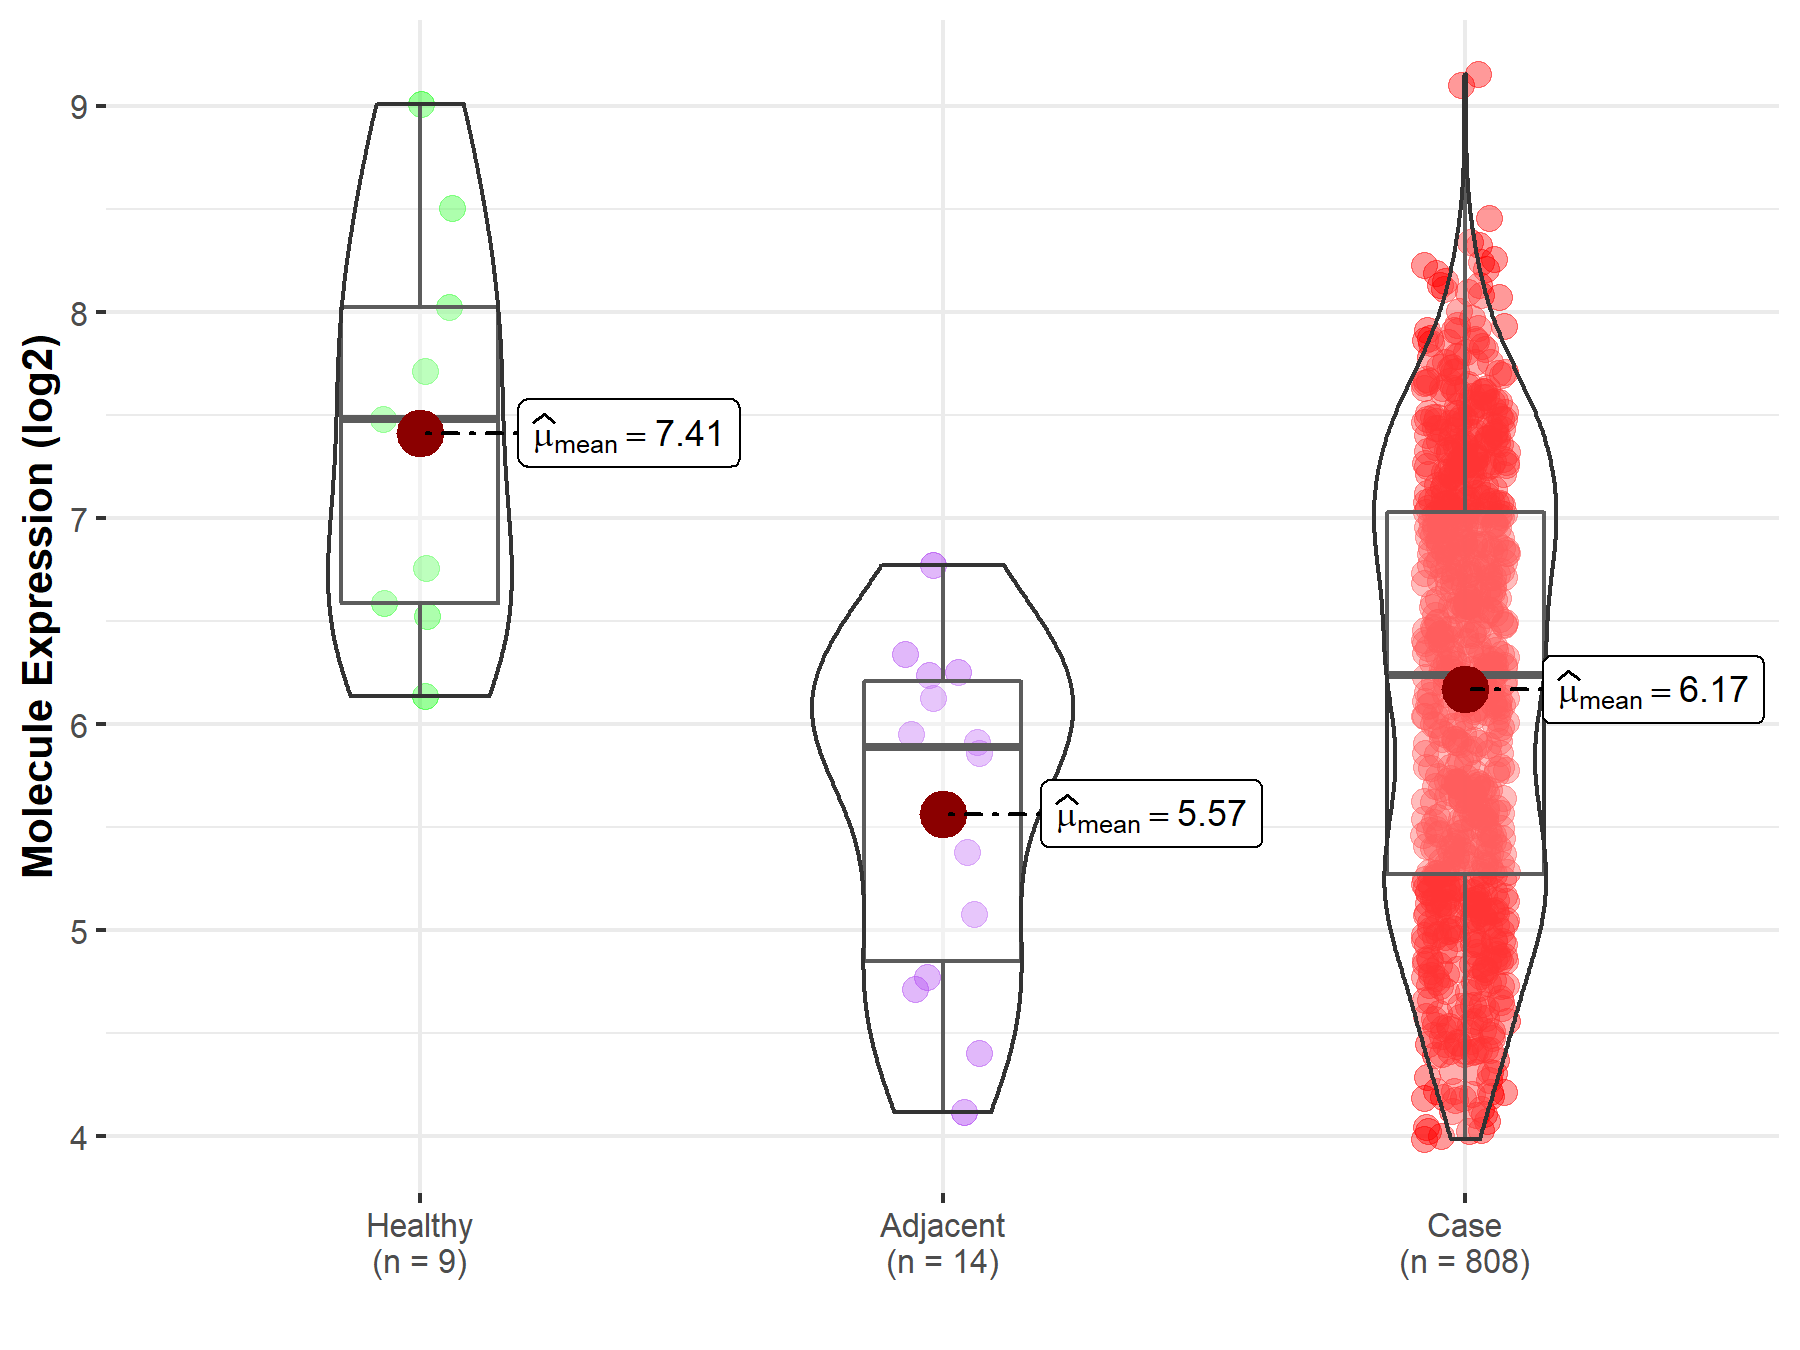
| Differential expression of molecule in resistant diseases | ||
| The Studied Tissue | Breast tissue | |
| The Specified Disease | Breast cancer | |
| The Expression Level of Disease Section Compare with the Healthy Individual Tissue | p-value: 1.35E-27; Fold-change: 7.60E-01; Z-score: 1.10E+00 | |
| The Expression Level of Disease Section Compare with the Adjacent Tissue | p-value: 3.71E-04; Fold-change: 4.97E-01; Z-score: 5.62E-01 | |
|
Molecule expression in the normal tissue adjacent to the diseased tissue of patients
Molecule expression in the diseased tissue of patients
Molecule expression in the normal tissue of healthy individuals
|
||
| Disease-specific Molecule Abundances |
|
Click to View the Clearer Original Diagram |
| Differential expression of molecule in resistant diseases | ||
| The Studied Tissue | Ovary | |
| The Specified Disease | Ovarian cancer | |
| The Expression Level of Disease Section Compare with the Healthy Individual Tissue | p-value: 5.19E-03; Fold-change: -1.24E+00; Z-score: -1.26E+00 | |
| The Expression Level of Disease Section Compare with the Adjacent Tissue | p-value: 1.70E-02; Fold-change: 3.49E-01; Z-score: 4.26E-01 | |
|
Molecule expression in the normal tissue adjacent to the diseased tissue of patients
Molecule expression in the diseased tissue of patients
Molecule expression in the normal tissue of healthy individuals
|
||
| Disease-specific Molecule Abundances |
|
Click to View the Clearer Original Diagram |
| Differential expression of molecule in resistant diseases | ||
| The Studied Tissue | Pituitary | |
| The Specified Disease | Pituitary cancer | |
| The Expression Level of Disease Section Compare with the Healthy Individual Tissue | p-value: 1.73E-03; Fold-change: -5.56E-01; Z-score: -1.39E+00 | |
|
Molecule expression in the diseased tissue of patients
Molecule expression in the normal tissue of healthy individuals
|
||
| Disease-specific Molecule Abundances |

|
Click to View the Clearer Original Diagram |
| The Studied Tissue | Pituitary | |
| The Specified Disease | Pituitary gonadotrope tumor | |
| The Expression Level of Disease Section Compare with the Healthy Individual Tissue | p-value: 8.71E-01; Fold-change: -4.27E-02; Z-score: -9.64E-02 | |
|
Molecule expression in the diseased tissue of patients
Molecule expression in the normal tissue of healthy individuals
|
||
| Disease-specific Molecule Abundances |
|
Click to View the Clearer Original Diagram |
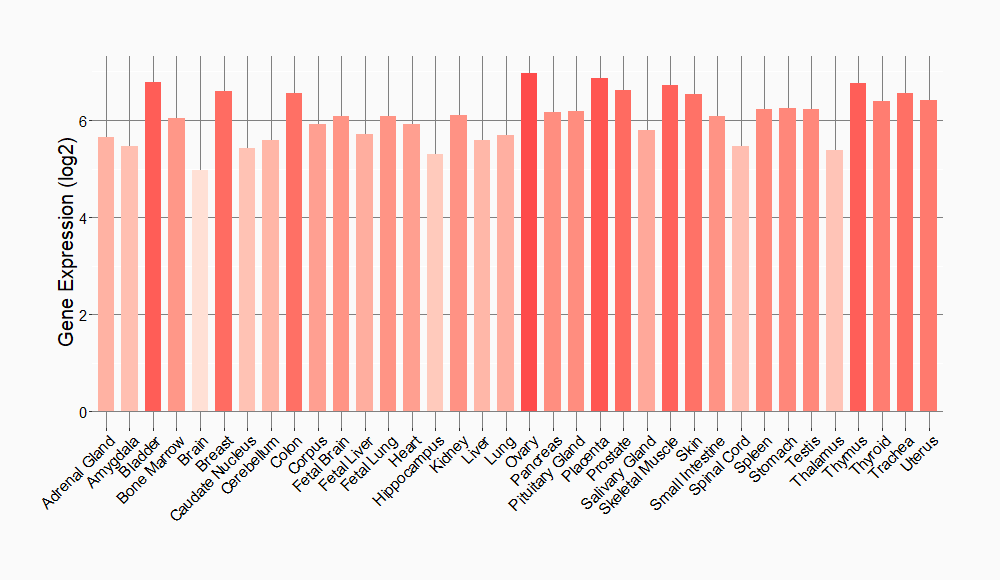
Tissue-specific Molecule Abundances in Healthy Individuals

|
||
References
If you find any error in data or bug in web service, please kindly report it to Dr. Sun and Dr. Yu.