Molecule Information
General Information of the Molecule (ID: Mol00142)
| Name |
Peroxisome proliferator-activated receptor gamma (PPARG)
,Homo sapiens
|
||||
|---|---|---|---|---|---|
| Synonyms |
PPAR-gamma; Nuclear receptor subfamily 1 group C member 3; NR1C3
Click to Show/Hide
|
||||
| Molecule Type |
Protein
|
||||
| Gene Name |
PPARG
|
||||
| Gene ID | |||||
| Location |
chr3:12287368-12434356[+]
|
||||
| Sequence |
MGETLGDSPIDPESDSFTDTLSANISQEMTMVDTEMPFWPTNFGISSVDLSVMEDHSHSF
DIKPFTTVDFSSISTPHYEDIPFTRTDPVVADYKYDLKLQEYQSAIKVEPASPPYYSEKT QLYNKPHEEPSNSLMAIECRVCGDKASGFHYGVHACEGCKGFFRRTIRLKLIYDRCDLNC RIHKKSRNKCQYCRFQKCLAVGMSHNAIRFGRMPQAEKEKLLAEISSDIDQLNPESADLR ALAKHLYDSYIKSFPLTKAKARAILTGKTTDKSPFVIYDMNSLMMGEDKIKFKHITPLQE QSKEVAIRIFQGCQFRSVEAVQEITEYAKSIPGFVNLDLNDQVTLLKYGVHEIIYTMLAS LMNKDGVLISEGQGFMTREFLKSLRKPFGDFMEPKFEFAVKFNALELDDSDLAIFIAVII LSGDRPGLLNVKPIEDIQDNLLQALELQLKLNHPESSQLFAKLLQKMTDLRQIVTEHVQL LQVIKKTETDMSLHPLLQEIYKDLY Click to Show/Hide
|
||||
| 3D-structure |
|
||||
| Function |
Nuclear receptor that binds peroxisome proliferators such as hypolipidemic drugs and fatty acids. Once activated by a ligand, the nuclear receptor binds to DNA specific PPAR response elements (PPRE) and modulates the transcription of its target genes, such as acyl-CoA oxidase. It therefore controls the peroxisomal beta-oxidation pathway of fatty acids. Key regulator of adipocyte differentiation and glucose homeostasis. ARF6 acts as a key regulator of the tissue-specific adipocyte P2 (aP2) enhancer. Acts as a critical regulator of gut homeostasis by suppressing NF-kappa-B-mediated proinflammatory responses. Plays a role in the regulation of cardiovascular circadian rhythms by regulating the transcription of ARNTL/BMAL1 in the blood vessels (By similarity).
Click to Show/Hide
|
||||
| Uniprot ID | |||||
| Ensembl ID | |||||
| HGNC ID | |||||
| Click to Show/Hide the Complete Species Lineage | |||||
Type(s) of Resistant Mechanism of This Molecule
Drug Resistance Data Categorized by Drug
Approved Drug(s)
2 drug(s) in total
| Drug Sensitivity Data Categorized by Their Corresponding Mechanisms | ||||
|
|
||||
| Disease Class: Anaplastic thyroid carcinoma [ICD-11: 2D10.3] | [1] | |||
| Sensitive Disease | Anaplastic thyroid carcinoma [ICD-11: 2D10.3] | |||
| Sensitive Drug | Doxorubicin | |||
| Molecule Alteration | Expression | Up-regulation |
||
| Experimental Note | Revealed Based on the Cell Line Data | |||
| Cell Pathway Regulation | Cell proliferation | Inhibition | hsa05200 | |
| Cell viability | Inhibition | hsa05200 | ||
| miR27b-3p/PPARgamma signaling pathway | Regulation | N.A. | ||
| In Vitro Model | 8305C cells | Thyroid | Homo sapiens (Human) | CVCL_1053 |
| SW1736 cells | Thyroid | Homo sapiens (Human) | CVCL_3883 | |
| Experiment for Molecule Alteration |
Western blot analysis; RIP assay; Luciferase reporter assay | |||
| Experiment for Drug Resistance |
CCK8 assay | |||
| Mechanism Description | The inhibitor of miR-27b-3p can increase the Dox sensitivity of ATC Dox-resistant cells while over-expression of PPARGamma also increased the Dox sensitivity of ATC-resistant cells. | |||
| Drug Resistance Data Categorized by Their Corresponding Mechanisms | ||||
|
|
||||
| Disease Class: Cholangiocarcinoma [ICD-11: 2C12.0] | [2] | |||
| Resistant Disease | Cholangiocarcinoma [ICD-11: 2C12.0] | |||
| Resistant Drug | Gemcitabine | |||
| Molecule Alteration | Expression | Down-regulation |
||
| Experimental Note | Revealed Based on the Cell Line Data | |||
| In Vitro Model | CCLP-1 cells | Liver | Homo sapiens (Human) | CVCL_0205 |
| MzChA-1 cells | Liver | Homo sapiens (Human) | CVCL_6932 | |
| Experiment for Molecule Alteration |
qRT-PCR | |||
| Experiment for Drug Resistance |
MTT assay | |||
| Mechanism Description | Transfection of miR130a-3p mimic suppressed the expression of PPARG and increased gemcitabine resistance. | |||
Disease- and Tissue-specific Abundances of This Molecule
ICD Disease Classification 02

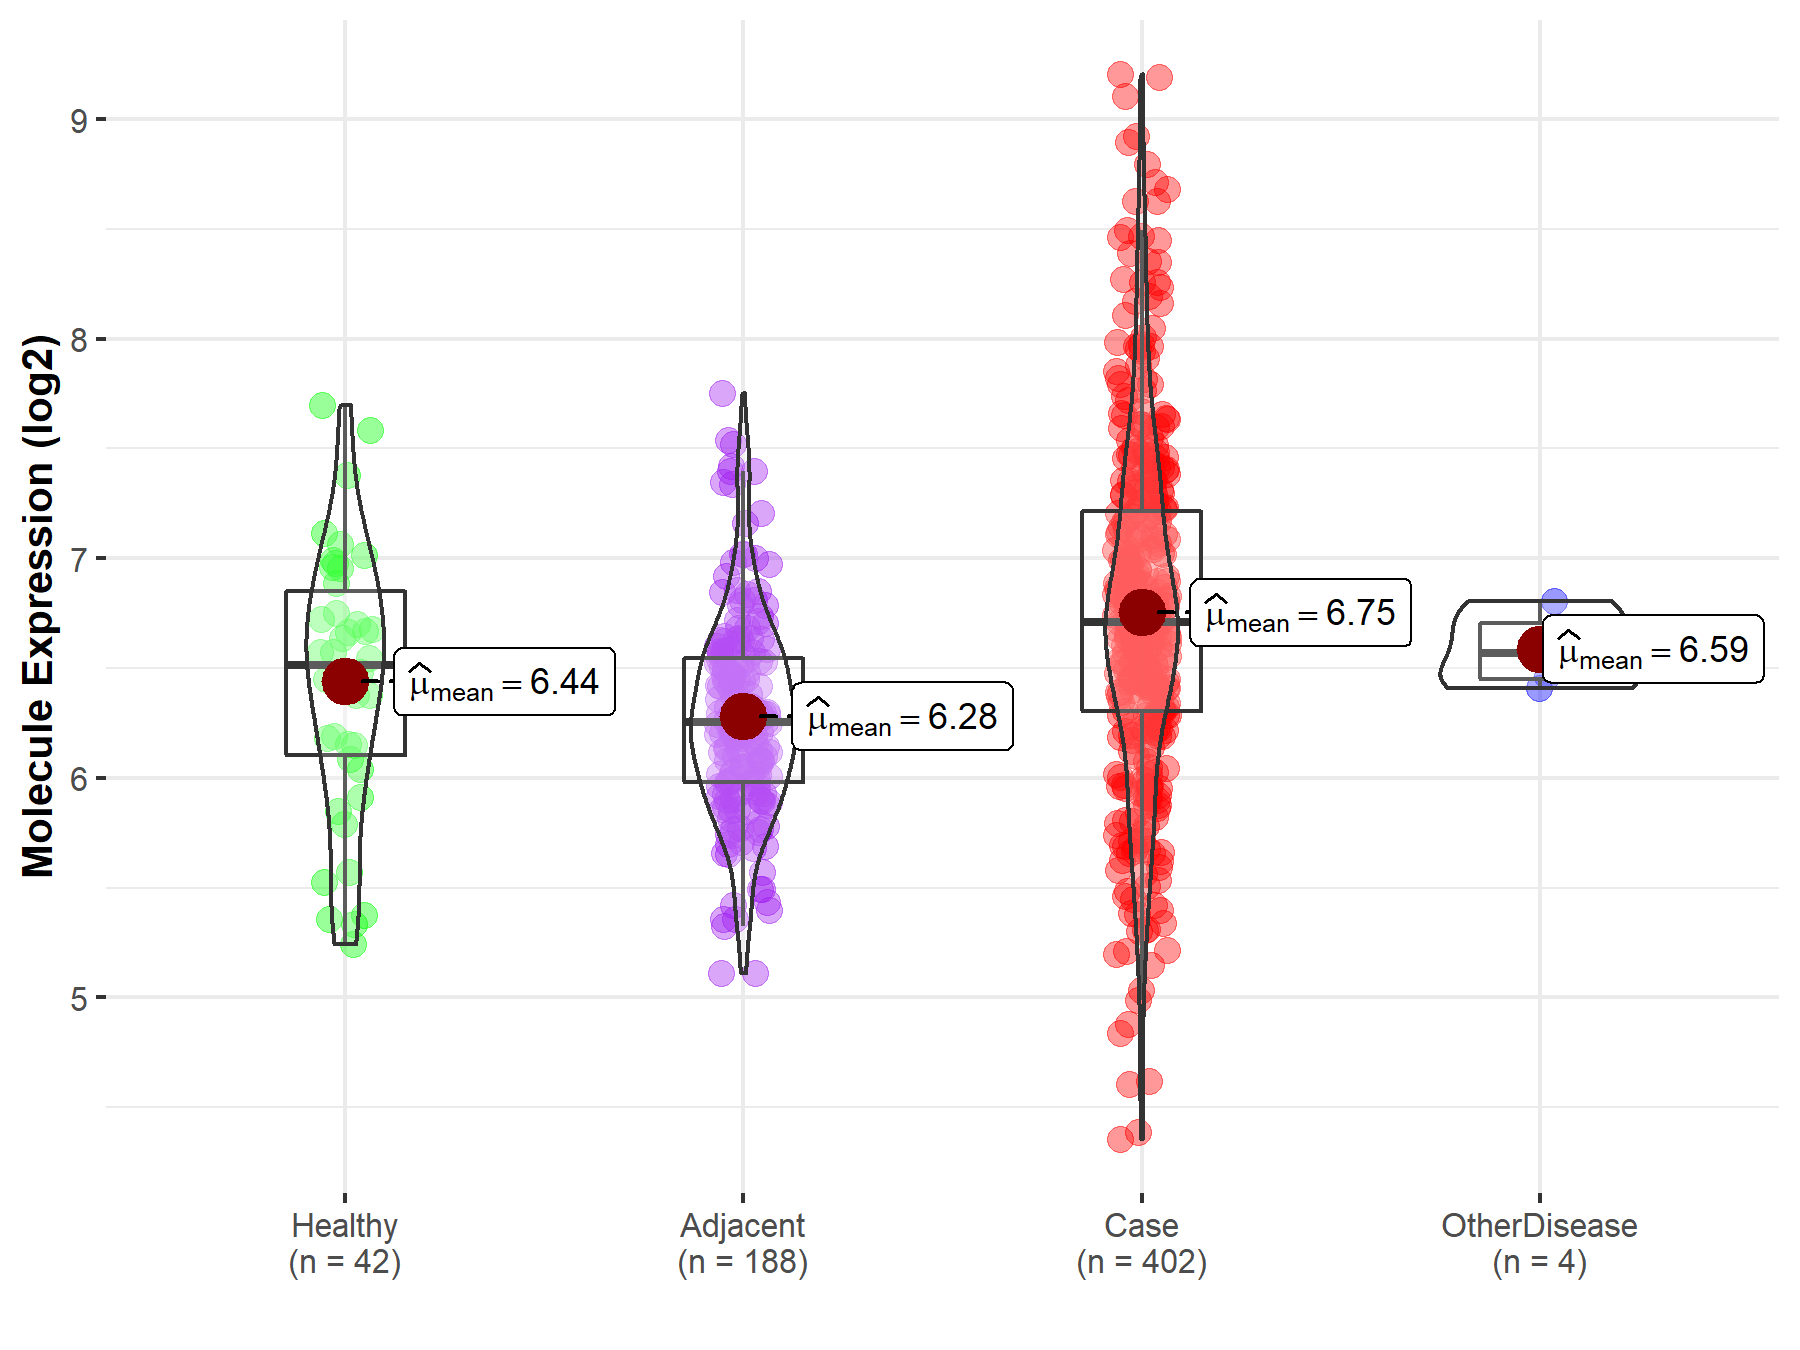
| Differential expression of molecule in resistant diseases | ||
| The Studied Tissue | Liver | |
| The Specified Disease | Liver cancer | |
| The Expression Level of Disease Section Compare with the Healthy Individual Tissue | p-value: 3.02E-03; Fold-change: 1.94E-01; Z-score: 3.22E-01 | |
| The Expression Level of Disease Section Compare with the Adjacent Tissue | p-value: 3.83E-18; Fold-change: 4.53E-01; Z-score: 9.76E-01 | |
| The Expression Level of Disease Section Compare with the Other Disease Section | p-value: 1.70E-01; Fold-change: 1.42E-01; Z-score: 7.72E-01 | |
|
Molecule expression in the normal tissue adjacent to the diseased tissue of patients
Molecule expression in the diseased tissue of patients
Molecule expression in the normal tissue of healthy individuals
Molecule expression in tissue other than the diseased tissue of patients
|
||
| Disease-specific Molecule Abundances |

|
Click to View the Clearer Original Diagram |
| Differential expression of molecule in resistant diseases | ||
| The Studied Tissue | Thyroid | |
| The Specified Disease | Thyroid cancer | |
| The Expression Level of Disease Section Compare with the Healthy Individual Tissue | p-value: 3.86E-27; Fold-change: -1.01E+00; Z-score: -2.02E+00 | |
| The Expression Level of Disease Section Compare with the Adjacent Tissue | p-value: 6.90E-14; Fold-change: -1.06E+00; Z-score: -1.95E+00 | |
|
Molecule expression in the normal tissue adjacent to the diseased tissue of patients
Molecule expression in the diseased tissue of patients
Molecule expression in the normal tissue of healthy individuals
|
||
| Disease-specific Molecule Abundances |

|
Click to View the Clearer Original Diagram |
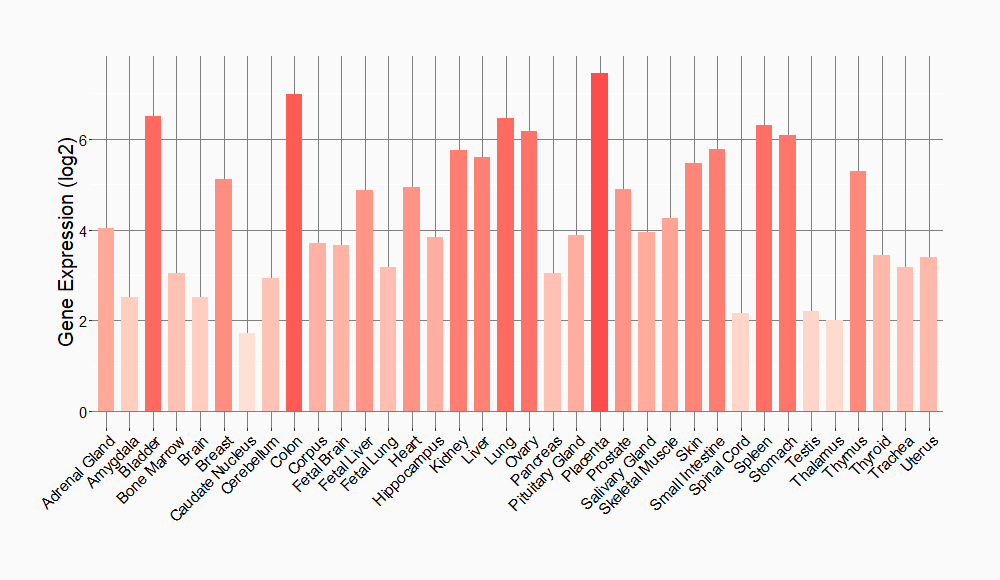
Tissue-specific Molecule Abundances in Healthy Individuals


|
||
References
If you find any error in data or bug in web service, please kindly report it to Dr. Sun and Dr. Yu.
