Molecule Information
General Information of the Molecule (ID: Mol00138)
| Name |
Platelet-derived growth factor receptor beta (PDGFRB)
,Homo sapiens
|
||||
|---|---|---|---|---|---|
| Molecule Type |
Protein
|
||||
| Gene Name |
PDGFRB
|
||||
| Gene ID | |||||
| Location |
chr5:150113839-150155872[-]
|
||||
| Sequence |
MRLPGAMPALALKGELLLLSLLLLLEPQISQGLVVTPPGPELVLNVSSTFVLTCSGSAPV
VWERMSQEPPQEMAKAQDGTFSSVLTLTNLTGLDTGEYFCTHNDSRGLETDERKRLYIFV PDPTVGFLPNDAEELFIFLTEITEITIPCRVTDPQLVVTLHEKKGDVALPVPYDHQRGFS GIFEDRSYICKTTIGDREVDSDAYYVYRLQVSSINVSVNAVQTVVRQGENITLMCIVIGN EVVNFEWTYPRKESGRLVEPVTDFLLDMPYHIRSILHIPSAELEDSGTYTCNVTESVNDH QDEKAINITVVESGYVRLLGEVGTLQFAELHRSRTLQVVFEAYPPPTVLWFKDNRTLGDS SAGEIALSTRNVSETRYVSELTLVRVKVAEAGHYTMRAFHEDAEVQLSFQLQINVPVRVL ELSESHPDSGEQTVRCRGRGMPQPNIIWSACRDLKRCPRELPPTLLGNSSEEESQLETNV TYWEEEQEFEVVSTLRLQHVDRPLSVRCTLRNAVGQDTQEVIVVPHSLPFKVVVISAILA LVVLTIISLIILIMLWQKKPRYEIRWKVIESVSSDGHEYIYVDPMQLPYDSTWELPRDQL VLGRTLGSGAFGQVVEATAHGLSHSQATMKVAVKMLKSTARSSEKQALMSELKIMSHLGP HLNVVNLLGACTKGGPIYIITEYCRYGDLVDYLHRNKHTFLQHHSDKRRPPSAELYSNAL PVGLPLPSHVSLTGESDGGYMDMSKDESVDYVPMLDMKGDVKYADIESSNYMAPYDNYVP SAPERTCRATLINESPVLSYMDLVGFSYQVANGMEFLASKNCVHRDLAARNVLICEGKLV KICDFGLARDIMRDSNYISKGSTFLPLKWMAPESIFNSLYTTLSDVWSFGILLWEIFTLG GTPYPELPMNEQFYNAIKRGYRMAQPAHASDEIYEIMQKCWEEKFEIRPPFSQLVLLLER LLGEGYKKKYQQVDEEFLRSDHPAILRSQARLPGFHGLRSPLDTSSVLYTAVQPNEGDND YIIPLPDPKPEVADEGPLEGSPSLASSTLNEVNTSSTISCDSPLEPQDEPEPEPQLELQV EPEPELEQLPDSGCPAPRAEAEDSFL Click to Show/Hide
|
||||
| 3D-structure |
|
||||
| Function |
Tyrosine-protein kinase that acts as cell-surface receptor for homodimeric PDGFB and PDGFD and for heterodimers formed by PDGFA and PDGFB, and plays an essential role in the regulation of embryonic development, cell proliferation, survival, differentiation, chemotaxis and migration. Plays an essential role in blood vessel development by promoting proliferation, migration and recruitment of pericytes and smooth muscle cells to endothelial cells. Plays a role in the migration of vascular smooth muscle cells and the formation of neointima at vascular injury sites. Required for normal development of the cardiovascular system. Required for normal recruitment of pericytes (mesangial cells) in the kidney glomerulus, and for normal formation of a branched network of capillaries in kidney glomeruli. Promotes rearrangement of the actin cytoskeleton and the formation of membrane ruffles. Binding of its cognate ligands - homodimeric PDGFB, heterodimers formed by PDGFA and PDGFB or homodimeric PDGFD -leads to the activation of several signaling cascades; the response depends on the nature of the bound ligand and is modulated by the formation of heterodimers between PDGFRA and PDGFRB. Phosphorylates PLCG1, PIK3R1, PTPN11, RASA1/GAP, CBL, SHC1 and NCK1. Activation of PLCG1 leads to the production of the cellular signaling molecules diacylglycerol and inositol 1,4,5-trisphosphate, mobilization of cytosolic Ca(2+) and the activation of protein kinase C. Phosphorylation of PIK3R1, the regulatory subunit of phosphatidylinositol 3-kinase, leads to the activation of the AKT1 signaling pathway. Phosphorylation of SHC1, or of the C-terminus of PTPN11, creates a binding site for GRB2, resulting in the activation of HRAS, RAF1 and down-stream MAP kinases, including MAPK1/ERK2 and/or MAPK3/ERK1. Promotes phosphorylation and activation of SRC family kinases. Promotes phosphorylation of PDCD6IP/ALIX and STAM. Receptor signaling is down-regulated by protein phosphatases that dephosphorylate the receptor and its down-stream effectors, and by rapid internalization of the activated receptor.
Click to Show/Hide
|
||||
| Uniprot ID | |||||
| Ensembl ID | |||||
| HGNC ID | |||||
| Click to Show/Hide the Complete Species Lineage | |||||
Type(s) of Resistant Mechanism of This Molecule
Drug Resistance Data Categorized by Drug
Approved Drug(s)
2 drug(s) in total
| Drug Resistance Data Categorized by Their Corresponding Mechanisms | ||||
|
|
||||
| Disease Class: Renal cell carcinoma [ICD-11: 2C90.0] | [1] | |||
| Resistant Disease | Renal cell carcinoma [ICD-11: 2C90.0] | |||
| Resistant Drug | Sunitinib | |||
| Molecule Alteration | Expression | Up-regulation |
||
| Differential expression of the molecule in resistant disease | ||||
| Classification of Disease | Kidney cancer [ICD-11: 2C90] | |||
| The Specified Disease | Renal cell carcinoma | |||
| The Studied Tissue | Blood | |||
| The Expression Level of Disease Section Compare with the Healthy Individual Tissue | p-value: 8.34E-01 Fold-change: 2.84E-02 Z-score: 2.17E-01 |
|||
| Experimental Note | Identified from the Human Clinical Data | |||
| In Vitro Model | Caki-2 cells | Kidney | Homo sapiens (Human) | CVCL_0235 |
| Experiment for Molecule Alteration |
Western blot analysis | |||
| Experiment for Drug Resistance |
MTT assay | |||
| Mechanism Description | High miR-942 levels in MRCC cells up-regulates MMP-9 and VEGF secretion to enhance endothelial migration and sunitinib resistance. | |||
| Drug Sensitivity Data Categorized by Their Corresponding Mechanisms | ||||
|
|
||||
| Disease Class: Liver cancer [ICD-11: 2C12.6] | [2] | |||
| Sensitive Disease | Liver cancer [ICD-11: 2C12.6] | |||
| Sensitive Drug | Sorafenib | |||
| Molecule Alteration | Expression | Down-regulation |
||
| Differential expression of the molecule in resistant disease | ||||
| Classification of Disease | Liver cancer [ICD-11: 2C12] | |||
| The Specified Disease | Liver cancer | |||
| The Studied Tissue | Liver tissue | |||
| The Expression Level of Disease Section Compare with the Healthy Individual Tissue | p-value: 9.23E-04 Fold-change: -1.35E-01 Z-score: -3.35E+00 |
|||
| Experimental Note | Identified from the Human Clinical Data | |||
| Cell Pathway Regulation | Cell invasion | Inhibition | hsa05200 | |
| Cell proliferation | Inhibition | hsa05200 | ||
| MAPK signaling pathway | Inhibition | hsa04010 | ||
| In Vitro Model | HepG2 cells | Liver | Homo sapiens (Human) | CVCL_0027 |
| SMMC7721 cells | Uterus | Homo sapiens (Human) | CVCL_0534 | |
| Experiment for Molecule Alteration |
Western blot analysis; Luciferase reporter assay | |||
| Experiment for Drug Resistance |
MTT assay | |||
| Mechanism Description | miR 378a enhances the sensitivity of liver cancer to sorafenib by targeting VEGFR, PDGFRbeta and c Raf. Sorafenib can suppress tumor growth through the inhibition of multiple tyrosine kinases, including VEGFR, PDGFRbeta and c-Raf. | |||
Disease- and Tissue-specific Abundances of This Molecule
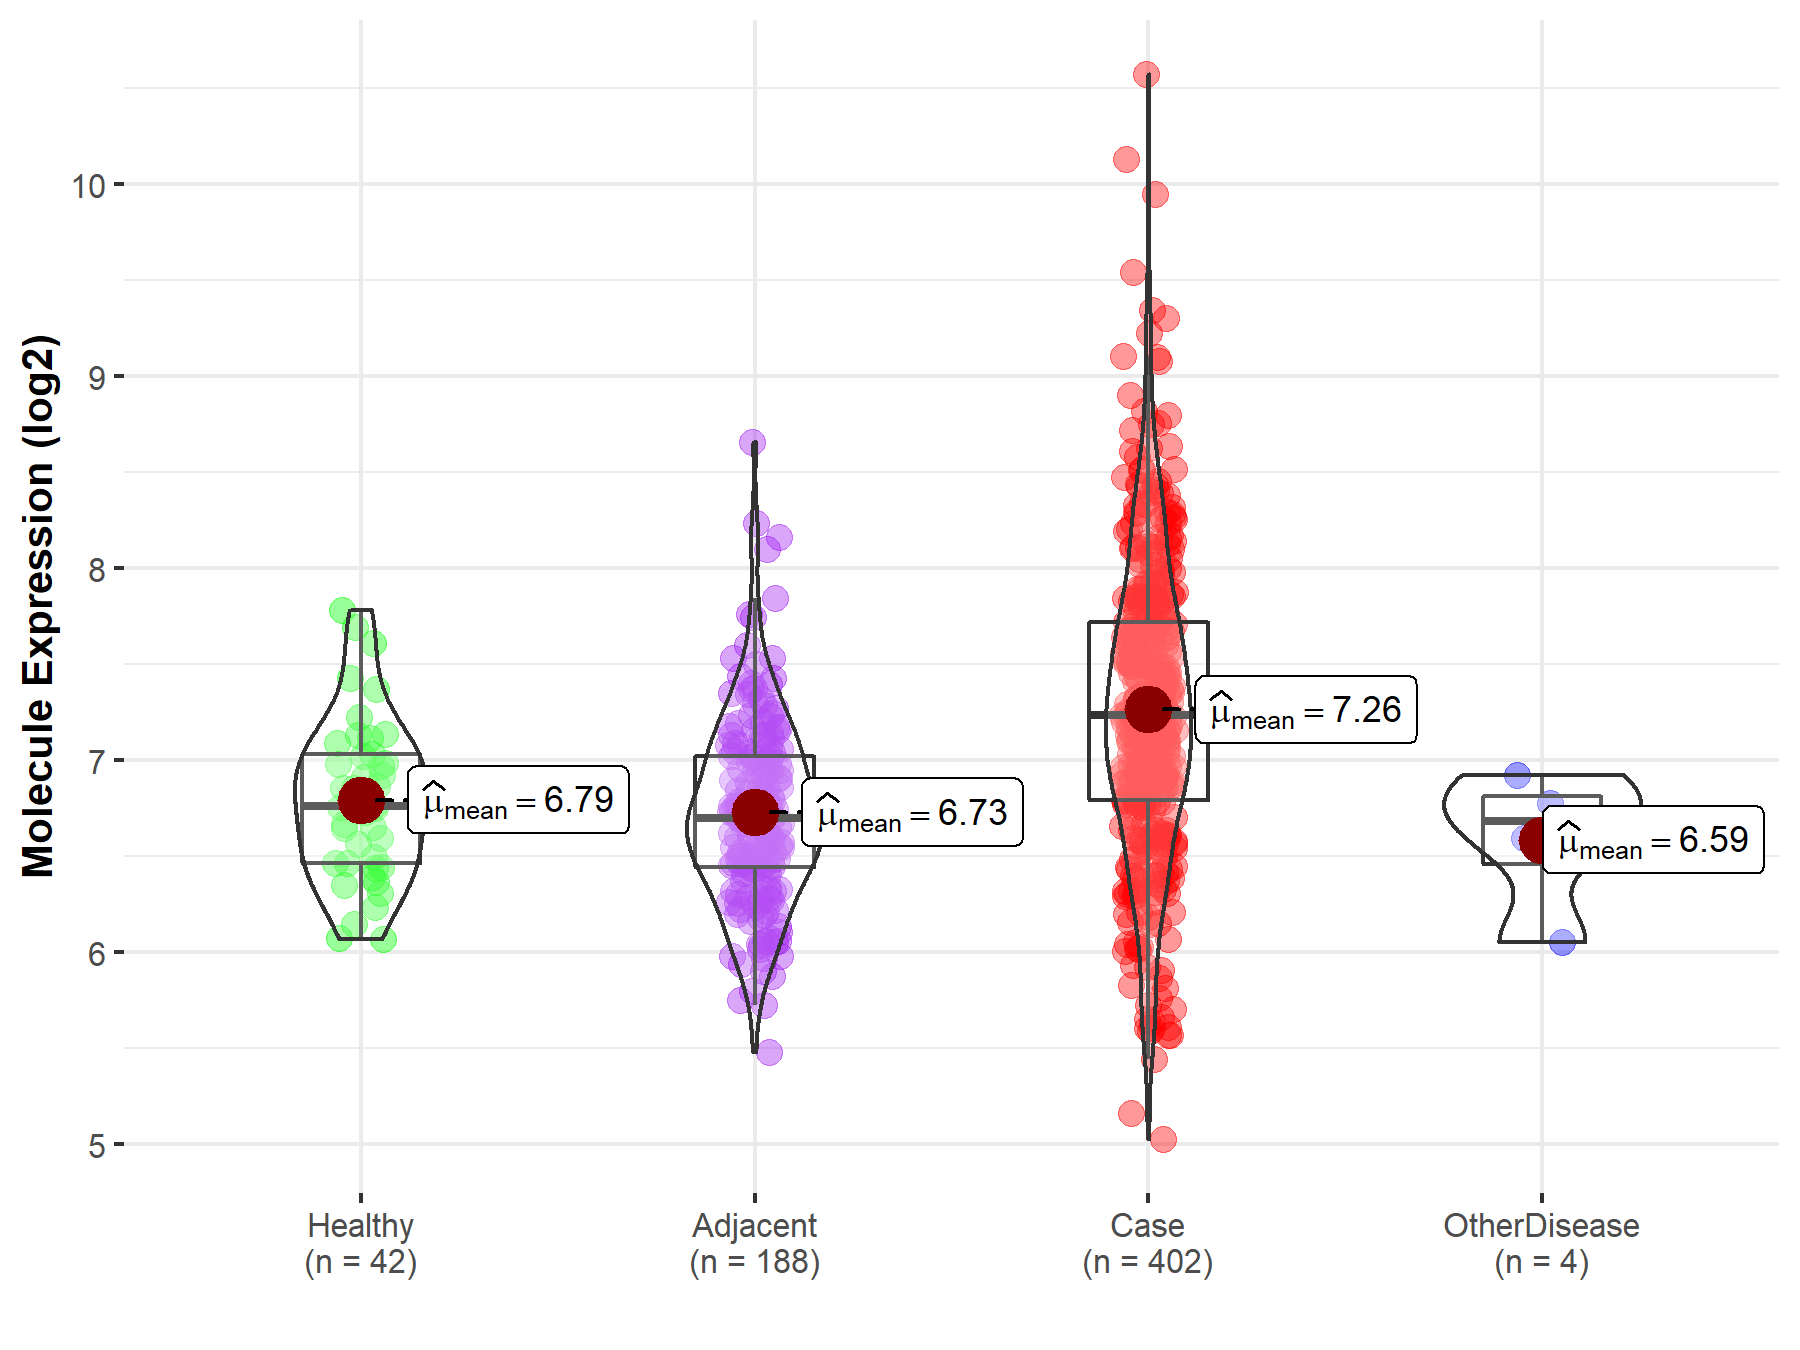
ICD Disease Classification 02

| Differential expression of molecule in resistant diseases | ||
| The Studied Tissue | Liver | |
| The Specified Disease | Liver cancer | |
| The Expression Level of Disease Section Compare with the Healthy Individual Tissue | p-value: 3.30E-08; Fold-change: 4.79E-01; Z-score: 1.13E+00 | |
| The Expression Level of Disease Section Compare with the Adjacent Tissue | p-value: 1.65E-21; Fold-change: 5.40E-01; Z-score: 1.10E+00 | |
| The Expression Level of Disease Section Compare with the Other Disease Section | p-value: 3.50E-02; Fold-change: 5.53E-01; Z-score: 1.45E+00 | |
|
Molecule expression in the normal tissue adjacent to the diseased tissue of patients
Molecule expression in the diseased tissue of patients
Molecule expression in the normal tissue of healthy individuals
Molecule expression in tissue other than the diseased tissue of patients
|
||
| Disease-specific Molecule Abundances |

|
Click to View the Clearer Original Diagram |
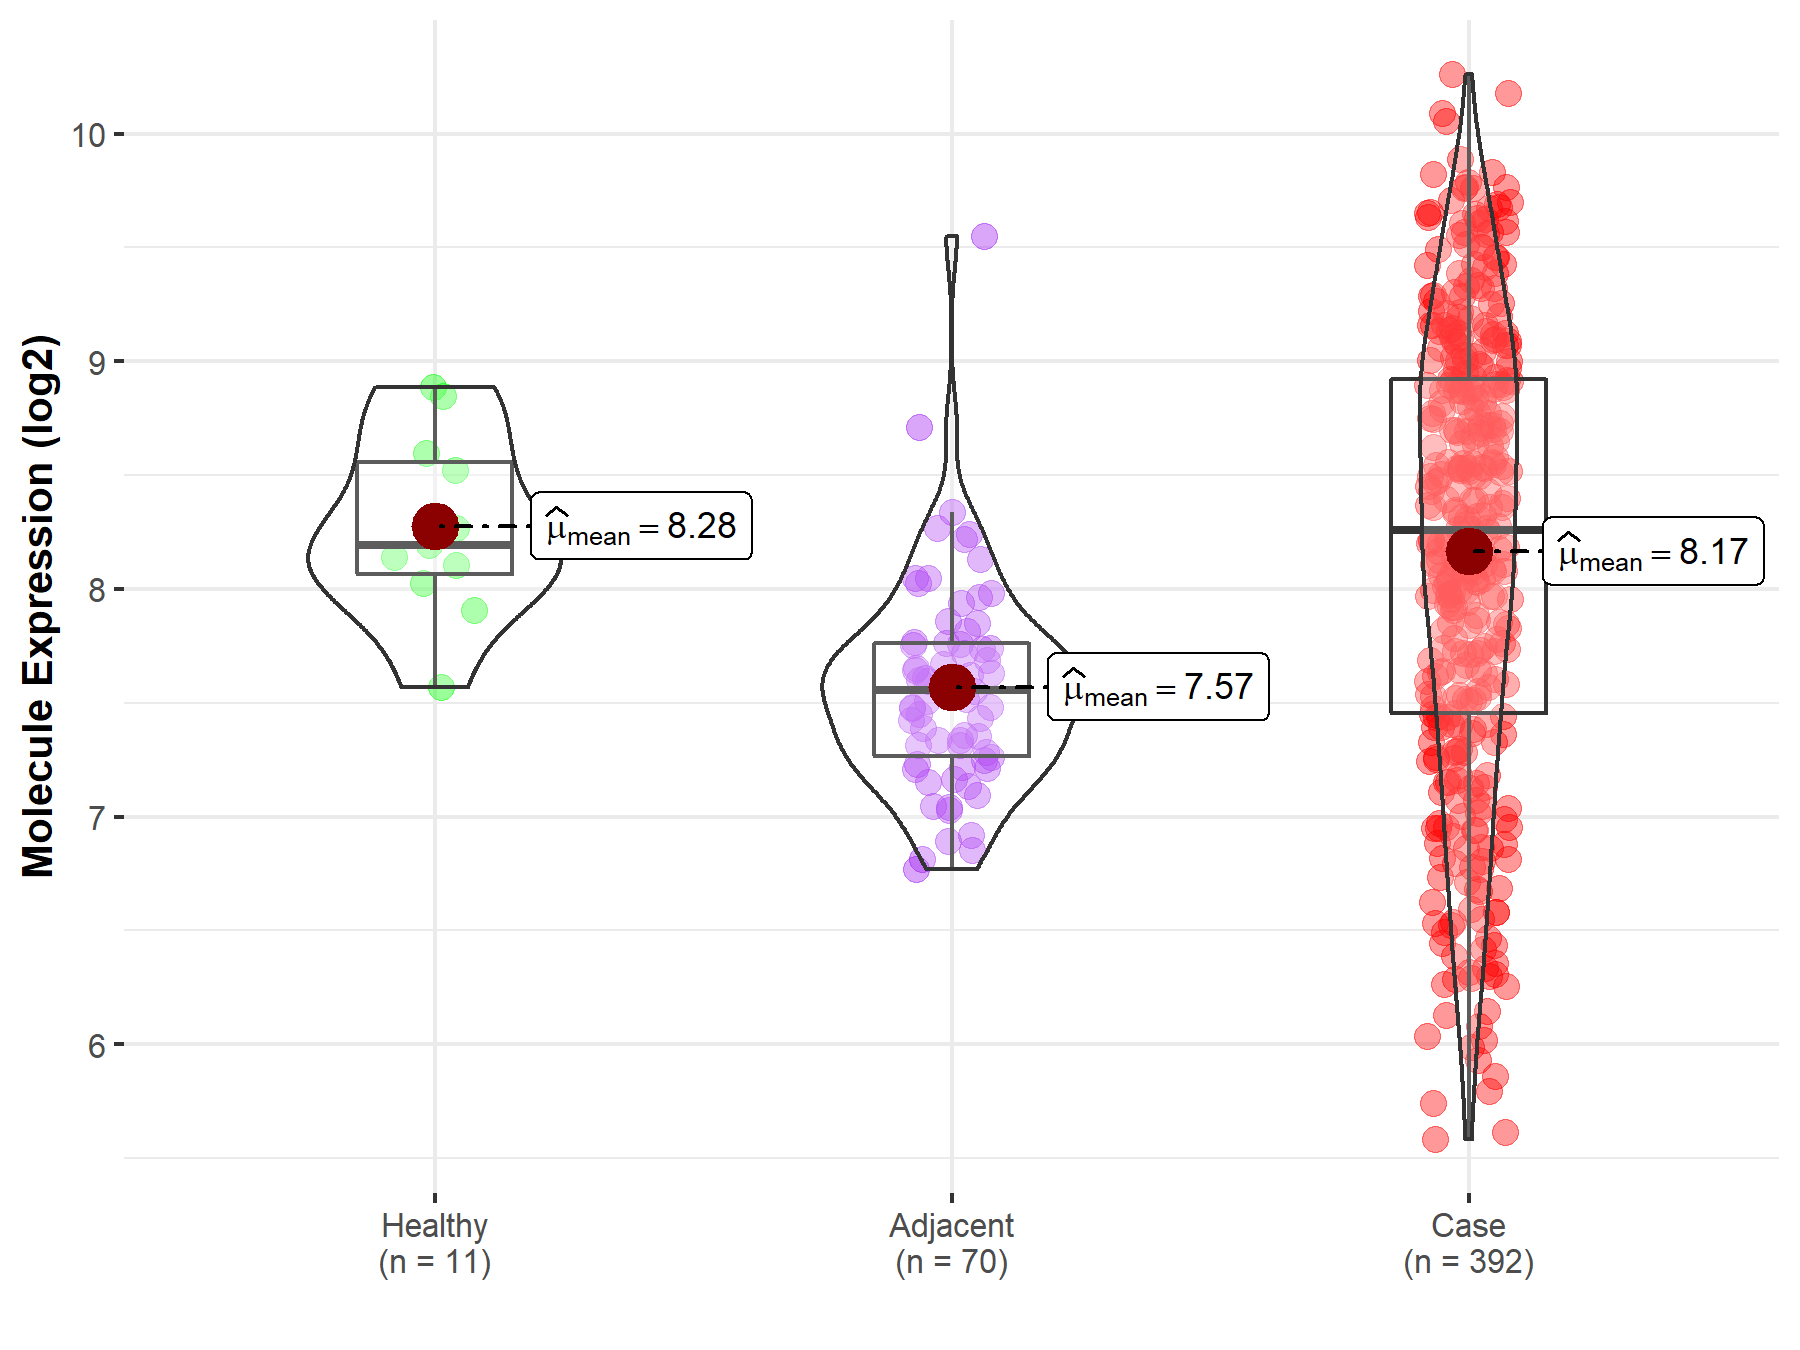
| Differential expression of molecule in resistant diseases | ||
| The Studied Tissue | Kidney | |
| The Specified Disease | Kidney cancer | |
| The Expression Level of Disease Section Compare with the Healthy Individual Tissue | p-value: 4.13E-01; Fold-change: 6.25E-02; Z-score: 1.55E-01 | |
| The Expression Level of Disease Section Compare with the Adjacent Tissue | p-value: 9.21E-14; Fold-change: 7.02E-01; Z-score: 1.53E+00 | |
|
Molecule expression in the normal tissue adjacent to the diseased tissue of patients
Molecule expression in the diseased tissue of patients
Molecule expression in the normal tissue of healthy individuals
|
||
| Disease-specific Molecule Abundances |

|
Click to View the Clearer Original Diagram |
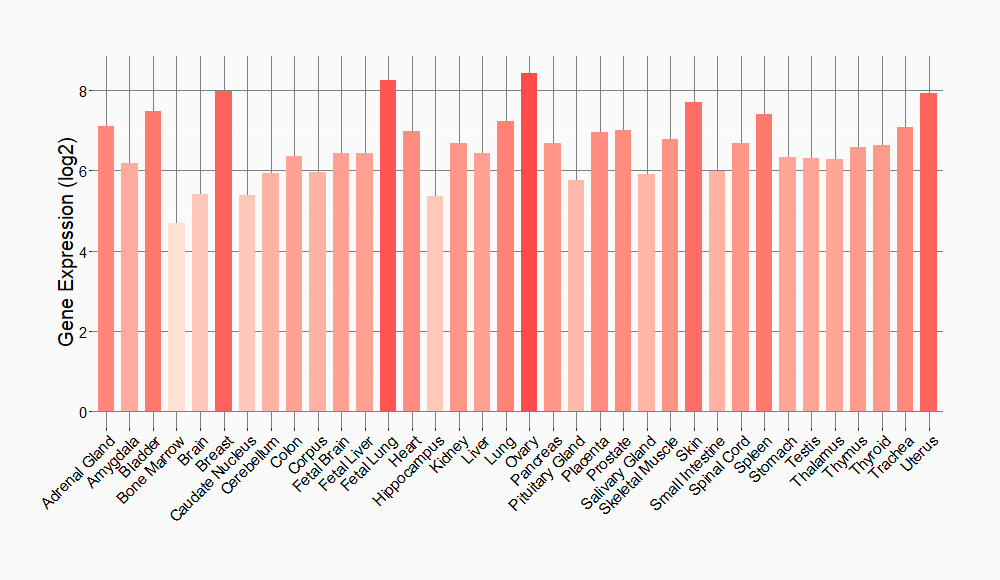
Tissue-specific Molecule Abundances in Healthy Individuals


|
||
References
If you find any error in data or bug in web service, please kindly report it to Dr. Sun and Dr. Yu.
