Molecule Information
General Information of the Molecule (ID: Mol00117)
| Name |
Collagenase 72 kDa type IV collagenase (MMP2)
,Homo sapiens
|
||||
|---|---|---|---|---|---|
| Synonyms |
72 kDa gelatinase; Gelatinase A; Matrix metalloproteinase-2; MMP-2; TBE-1; CLG4A
Click to Show/Hide
|
||||
| Molecule Type |
Protein
|
||||
| Gene Name |
MMP2
|
||||
| Gene ID | |||||
| Location |
chr16:55389700-55506691[+]
|
||||
| Sequence |
MEALMARGALTGPLRALCLLGCLLSHAAAAPSPIIKFPGDVAPKTDKELAVQYLNTFYGC
PKESCNLFVLKDTLKKMQKFFGLPQTGDLDQNTIETMRKPRCGNPDVANYNFFPRKPKWD KNQITYRIIGYTPDLDPETVDDAFARAFQVWSDVTPLRFSRIHDGEADIMINFGRWEHGD GYPFDGKDGLLAHAFAPGTGVGGDSHFDDDELWTLGEGQVVRVKYGNADGEYCKFPFLFN GKEYNSCTDTGRSDGFLWCSTTYNFEKDGKYGFCPHEALFTMGGNAEGQPCKFPFRFQGT SYDSCTTEGRTDGYRWCGTTEDYDRDKKYGFCPETAMSTVGGNSEGAPCVFPFTFLGNKY ESCTSAGRSDGKMWCATTANYDDDRKWGFCPDQGYSLFLVAAHEFGHAMGLEHSQDPGAL MAPIYTYTKNFRLSQDDIKGIQELYGASPDIDLGTGPTPTLGPVTPEICKQDIVFDGIAQ IRGEIFFFKDRFIWRTVTPRDKPMGPLLVATFWPELPEKIDAVYEAPQEEKAVFFAGNEY WIYSASTLERGYPKPLTSLGLPPDVQRVDAAFNWSKNKKTYIFAGDKFWRYNEVKKKMDP GFPKLIADAWNAIPDNLDAVVDLQGGGHSYFFKGAYYLKLENQSLKSVKFGSIKSDWLGC Click to Show/Hide
|
||||
| 3D-structure |
|
||||
| Function |
Ubiquitinous metalloproteinase that is involved in diverse functions such as remodeling of the vasculature, angiogenesis, tissue repair, tumor invasion, inflammation, and atherosclerotic plaque rupture. As well as degrading extracellular matrix proteins, can also act on several nonmatrix proteins such as big endothelial 1 and beta-type CGRP promoting vasoconstriction. Also cleaves KISS at a Gly-|-Leu bond. Appears to have a role in myocardial cell death pathways. Contributes to myocardial oxidative stress by regulating the activity of GSK3beta. Cleaves GSK3beta in vitro. Involved in the formation of the fibrovascular tissues in association with MMP14.; FUNCTION: PEX, the C-terminal non-catalytic fragment of MMP2, posseses anti-angiogenic and anti-tumor properties and inhibits cell migration and cell adhesion to FGF2 and vitronectin. Ligand for integrinv/beta3 on the surface of blood vessels.; FUNCTION: [Isoform 2]: Mediates the proteolysis of CHUK/IKKA and initiates a primary innate immune response by inducing mitochondrial-nuclear stress signaling with activation of the pro-inflammatory NF-kappaB, NFAT and IRF transcriptional pathways.
Click to Show/Hide
|
||||
| Uniprot ID | |||||
| Ensembl ID | |||||
| HGNC ID | |||||
| Click to Show/Hide the Complete Species Lineage | |||||
Type(s) of Resistant Mechanism of This Molecule
Drug Resistance Data Categorized by Drug
Approved Drug(s)
3 drug(s) in total
| Drug Sensitivity Data Categorized by Their Corresponding Mechanisms | ||||
|
|
||||
| Disease Class: Gastric cancer [ICD-11: 2B72.1] | [1] | |||
| Sensitive Disease | Gastric cancer [ICD-11: 2B72.1] | |||
| Sensitive Drug | Vincristine | |||
| Molecule Alteration | Expression | Down-regulation |
||
| Differential expression of the molecule in resistant disease | ||||
| Classification of Disease | Gastric cancer [ICD-11: 2B72] | |||
| The Specified Disease | Gastric cancer | |||
| The Studied Tissue | Gastric tissue | |||
| The Expression Level of Disease Section Compare with the Healthy Individual Tissue | p-value: 5.08E-01 Fold-change: -3.40E-02 Z-score: -7.98E-01 |
|||
| Experimental Note | Identified from the Human Clinical Data | |||
| Cell Pathway Regulation | Cell apoptosis | Activation | hsa04210 | |
| Cell invasion | Inhibition | hsa05200 | ||
| Cell migration | Inhibition | hsa04670 | ||
| In Vitro Model | GES-1 cells | Gastric | Homo sapiens (Human) | CVCL_EQ22 |
| SGC7901/VCR cells | Gastric | Homo sapiens (Human) | CVCL_VU58 | |
| Experiment for Molecule Alteration |
qRT-PCR; Western blot analysis | |||
| Experiment for Drug Resistance |
Flow cytometry assay; Wound healing and transwell assay | |||
| Mechanism Description | Overexpression of miR647 sensitizes tumors to chemotherapy in vivo by reducing the expression levels of ANk2, FAk, MMP2, MMP12, CD44 and SNAIL1. | |||
| Drug Sensitivity Data Categorized by Their Corresponding Mechanisms | ||||
|
|
||||
| Disease Class: Cholangiocarcinoma [ICD-11: 2C12.0] | [2] | |||
| Sensitive Disease | Cholangiocarcinoma [ICD-11: 2C12.0] | |||
| Sensitive Drug | Gemcitabine | |||
| Molecule Alteration | Expression | Down-regulation |
||
| Differential expression of the molecule in resistant disease | ||||
| Classification of Disease | Liver cancer [ICD-11: 2C12] | |||
| The Specified Disease | Liver cancer | |||
| The Studied Tissue | Liver tissue | |||
| The Expression Level of Disease Section Compare with the Healthy Individual Tissue | p-value: 4.80E-06 Fold-change: -5.35E-02 Z-score: -5.09E+00 |
|||
| Experimental Note | Revealed Based on the Cell Line Data | |||
| In Vitro Model | HuCCT1 cells | Bile duct | Homo sapiens (Human) | CVCL_0324 |
| HuH28 cells | Bile duct | Homo sapiens (Human) | CVCL_2955 | |
| Experiment for Molecule Alteration |
Western blot analysis | |||
| Experiment for Drug Resistance |
CCK8 assay | |||
| Mechanism Description | Two miR-29b target genes, PIk3R1 and MMP-2, that are, at least partly, responsible for the resistance of CCA Gem treatment. PIk3R1 encodes phosphoinositide 3-kinase (PI3k) regulatory subunit designated p85 alpha; p85 alpha is regarded as integrator of multiple signaling pathways that together promote cell proliferation, cell survival, and carcinogenesis. | |||
| Drug Resistance Data Categorized by Their Corresponding Mechanisms | ||||
|
|
||||
| Disease Class: Oral squamous cell carcinoma [ICD-11: 2B6E.0] | [3] | |||
| Resistant Disease | Oral squamous cell carcinoma [ICD-11: 2B6E.0] | |||
| Resistant Drug | Cisplatin | |||
| Molecule Alteration | Expression | Up-regulation |
||
| Experimental Note | Identified from the Human Clinical Data | |||
| Cell Pathway Regulation | Cell apoptosis | Inhibition | hsa04210 | |
| Cell migration | Activation | hsa04670 | ||
| Cell proliferation | Activation | hsa05200 | ||
| In Vitro Model | SCC25 cells | Oral | Homo sapiens (Human) | CVCL_1682 |
| SCC4 cells | Tongue | Homo sapiens (Human) | CVCL_1684 | |
| SCC9 cells | Tongue | Homo sapiens (Human) | CVCL_1685 | |
| Experiment for Molecule Alteration |
Western blot analysis | |||
| Experiment for Drug Resistance |
MTT assay | |||
| Mechanism Description | miR-29a expression was decreased in clinical OSCC cancer specimens. miR-29a negatively regulated MMP2 transcription and translation through directly binding to 3'-UTR. miR-29a overexpression could inhibit OSCC cancer cell invasion and anti-apoptotic ability, and vice versa. | |||
Disease- and Tissue-specific Abundances of This Molecule
ICD Disease Classification 02

| Differential expression of molecule in resistant diseases | ||
| The Studied Tissue | Oral tissue | |
| The Specified Disease | Oral squamous cell carcinoma | |
| The Expression Level of Disease Section Compare with the Healthy Individual Tissue | p-value: 1.14E-07; Fold-change: -6.56E-01; Z-score: -1.66E+00 | |
| The Expression Level of Disease Section Compare with the Adjacent Tissue | p-value: 4.56E-02; Fold-change: -6.61E-02; Z-score: -2.63E-01 | |
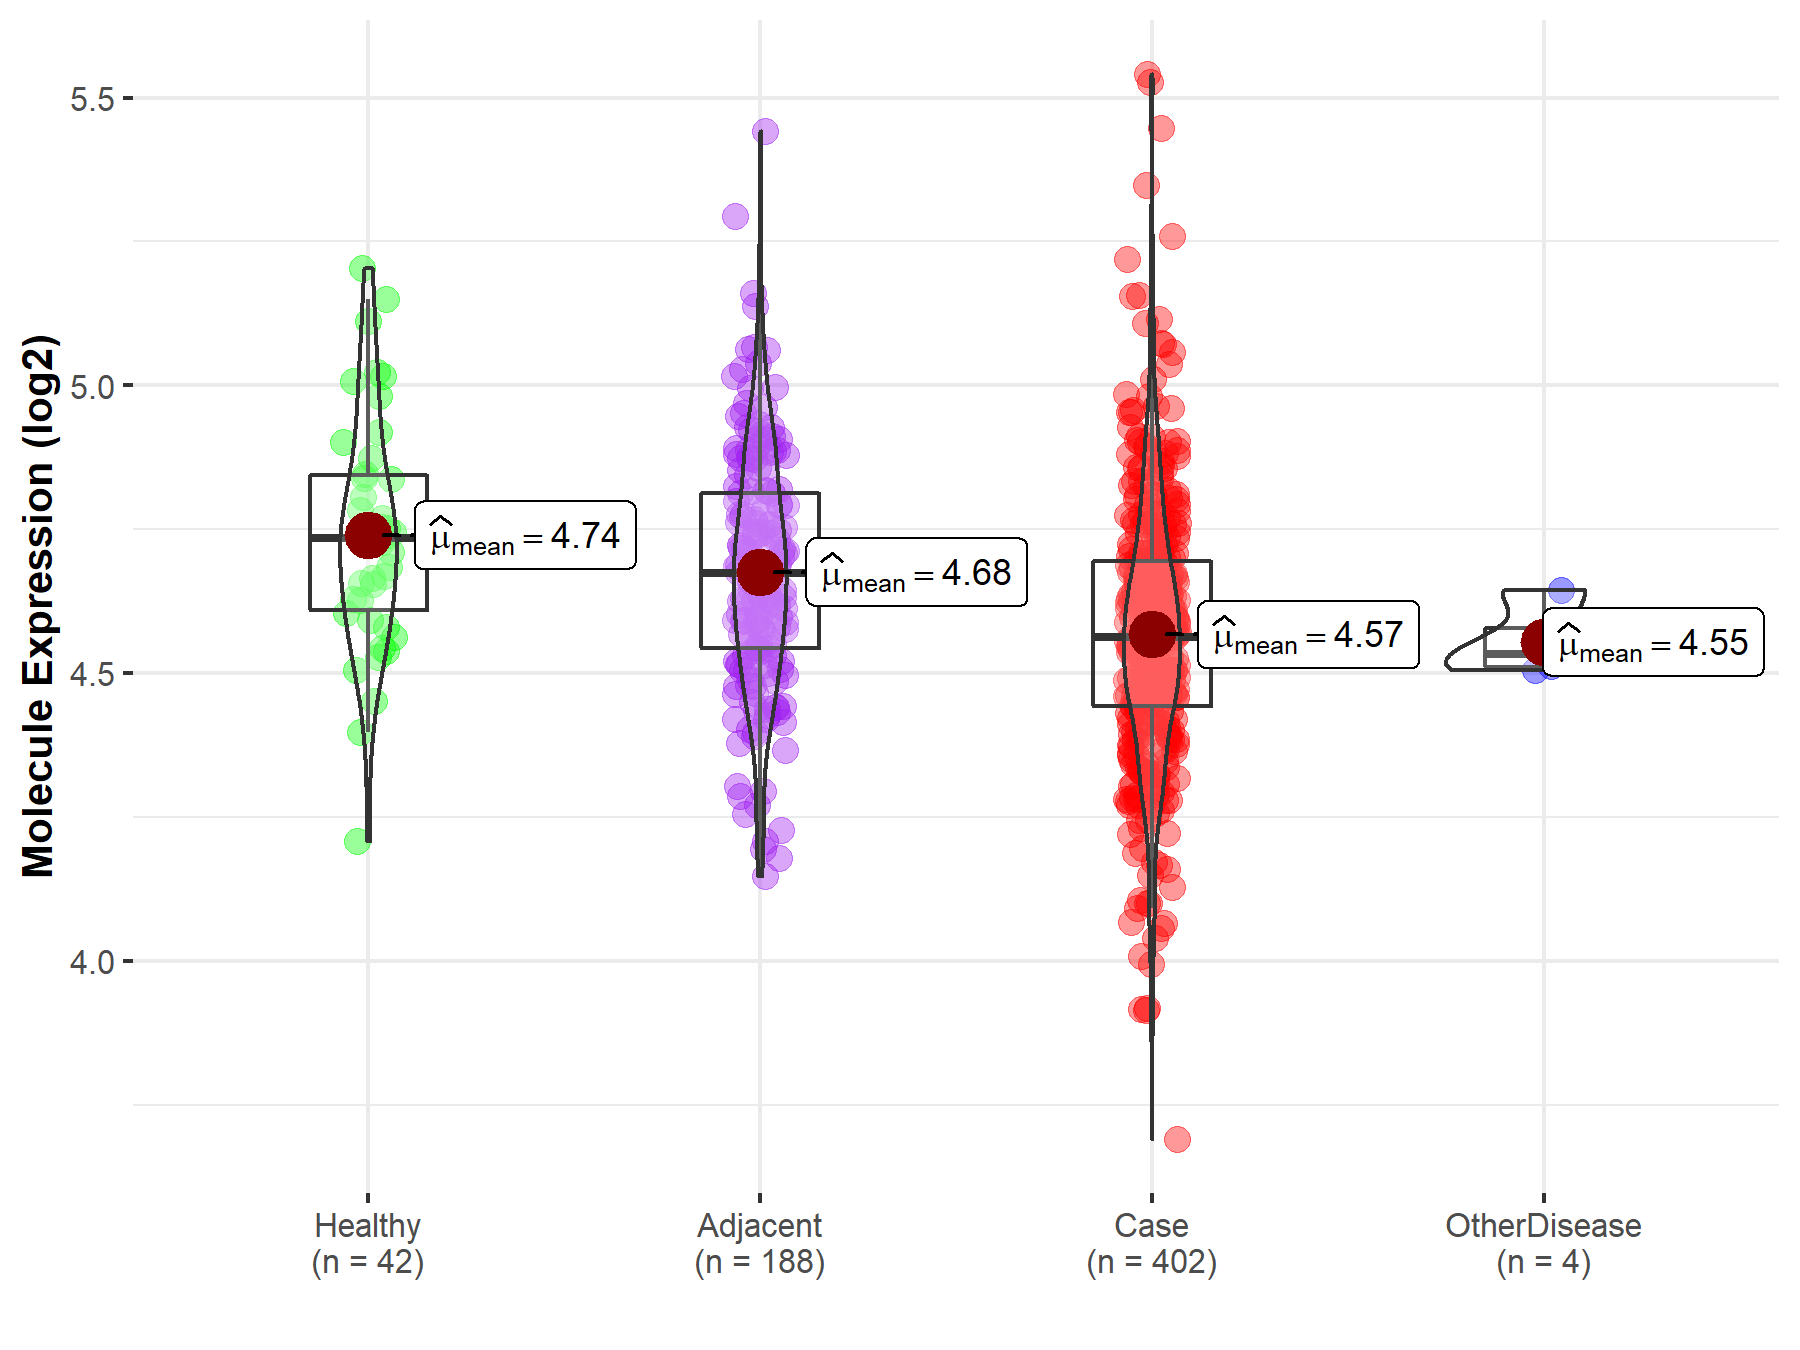
|
Molecule expression in the normal tissue adjacent to the diseased tissue of patients
Molecule expression in the diseased tissue of patients
Molecule expression in the normal tissue of healthy individuals
|
||
| Disease-specific Molecule Abundances |

|
Click to View the Clearer Original Diagram |
| Differential expression of molecule in resistant diseases | ||
| The Studied Tissue | Gastric tissue | |
| The Specified Disease | Gastric cancer | |
| The Expression Level of Disease Section Compare with the Healthy Individual Tissue | p-value: 5.08E-01; Fold-change: -4.98E-02; Z-score: -2.04E-01 | |
| The Expression Level of Disease Section Compare with the Adjacent Tissue | p-value: 8.13E-03; Fold-change: 1.50E-01; Z-score: 9.03E-01 | |
|
Molecule expression in the normal tissue adjacent to the diseased tissue of patients
Molecule expression in the diseased tissue of patients
Molecule expression in the normal tissue of healthy individuals
|
||
| Disease-specific Molecule Abundances |

|
Click to View the Clearer Original Diagram |
| Differential expression of molecule in resistant diseases | ||
| The Studied Tissue | Liver | |
| The Specified Disease | Liver cancer | |
| The Expression Level of Disease Section Compare with the Healthy Individual Tissue | p-value: 4.80E-06; Fold-change: -1.73E-01; Z-score: -8.39E-01 | |
| The Expression Level of Disease Section Compare with the Adjacent Tissue | p-value: 3.91E-08; Fold-change: -1.13E-01; Z-score: -5.38E-01 | |
| The Expression Level of Disease Section Compare with the Other Disease Section | p-value: 7.25E-01; Fold-change: 2.79E-02; Z-score: 4.37E-01 | |
|
Molecule expression in the normal tissue adjacent to the diseased tissue of patients
Molecule expression in the diseased tissue of patients
Molecule expression in the normal tissue of healthy individuals
Molecule expression in tissue other than the diseased tissue of patients
|
||
| Disease-specific Molecule Abundances |

|
Click to View the Clearer Original Diagram |
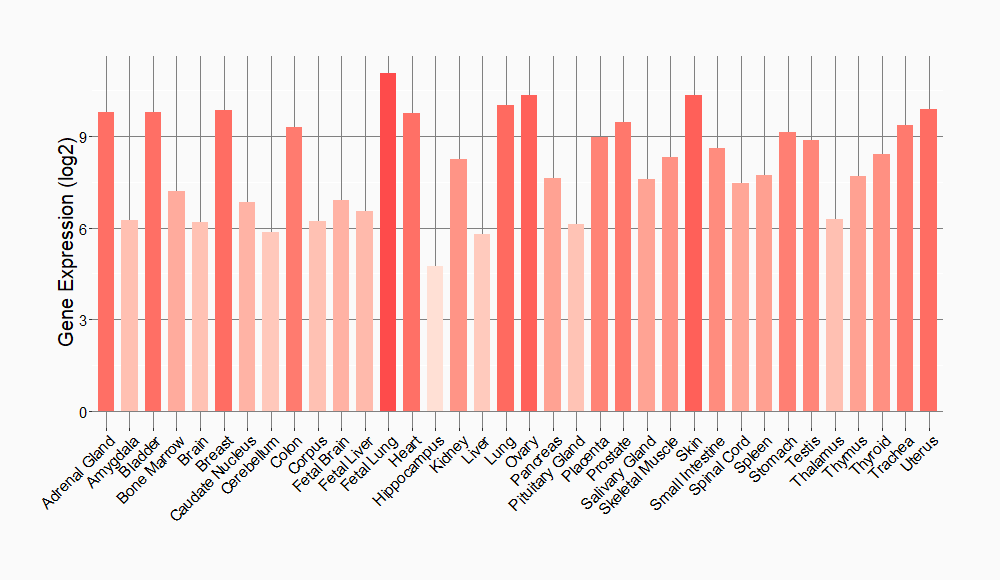
Tissue-specific Molecule Abundances in Healthy Individuals


|
||
References
If you find any error in data or bug in web service, please kindly report it to Dr. Sun and Dr. Yu.
