Molecule Information
General Information of the Molecule (ID: Mol00100)
| Name |
Insulin receptor substrate 1 (IRS1)
,Homo sapiens
|
||||
|---|---|---|---|---|---|
| Synonyms |
IRS-1
Click to Show/Hide
|
||||
| Molecule Type |
Protein
|
||||
| Gene Name |
IRS1
|
||||
| Gene ID | |||||
| Location |
chr2:226731312-226799820[-]
|
||||
| Sequence |
MASPPESDGFSDVRKVGYLRKPKSMHKRFFVLRAASEAGGPARLEYYENEKKWRHKSSAP
KRSIPLESCFNINKRADSKNKHLVALYTRDEHFAIAADSEAEQDSWYQALLQLHNRAKGH HDGAAALGAGGGGGSCSGSSGLGEAGEDLSYGDVPPGPAFKEVWQVILKPKGLGQTKNLI GIYRLCLTSKTISFVKLNSEAAAVVLQLMNIRRCGHSENFFFIEVGRSAVTGPGEFWMQV DDSVVAQNMHETILEAMRAMSDEFRPRSKSQSSSNCSNPISVPLRRHHLNNPPPSQVGLT RRSRTESITATSPASMVGGKPGSFRVRASSDGEGTMSRPASVDGSPVSPSTNRTHAHRHR GSARLHPPLNHSRSIPMPASRCSPSATSPVSLSSSSTSGHGSTSDCLFPRRSSASVSGSP SDGGFISSDEYGSSPCDFRSSFRSVTPDSLGHTPPARGEEELSNYICMGGKGPSTLTAPN GHYILSRGGNGHRCTPGTGLGTSPALAGDEAASAADLDNRFRKRTHSAGTSPTITHQKTP SQSSVASIEEYTEMMPAYPPGGGSGGRLPGHRHSAFVPTRSYPEEGLEMHPLERRGGHHR PDSSTLHTDDGYMPMSPGVAPVPSGRKGSGDYMPMSPKSVSAPQQIINPIRRHPQRVDPN GYMMMSPSGGCSPDIGGGPSSSSSSSNAVPSGTSYGKLWTNGVGGHHSHVLPHPKPPVES SGGKLLPCTGDYMNMSPVGDSNTSSPSDCYYGPEDPQHKPVLSYYSLPRSFKHTQRPGEP EEGARHQHLRLSTSSGRLLYAATADDSSSSTSSDSLGGGYCGARLEPSLPHPHHQVLQPH LPRKVDTAAQTNSRLARPTRLSLGDPKASTLPRAREQQQQQQPLLHPPEPKSPGEYVNIE FGSDQSGYLSGPVAFHSSPSVRCPSQLQPAPREEETGTEEYMKMDLGPGRRAAWQESTGV EMGRLGPAPPGAASICRPTRAVPSSRGDYMTMQMSCPRQSYVDTSPAAPVSYADMRTGIA AEEVSLPRATMAAASSSSAASASPTGPQGAAELAAHSSLLGGPQGPGGMSAFTRVNLSPN RNQSAKVIRADPQGCRRRHSSETFSSTPSATRVGNTVPFGAGAAVGGGGGSSSSSEDVKR HSSASFENVWLRPGELGGAPKEPAKLCGAAGGLENGLNYIDLDLVKDFKQCPQECTPEPQ PPPPPPPHQPLGSGESSSTRRSSEDLSAYASISFQKQPEDRQ Click to Show/Hide
|
||||
| 3D-structure |
|
||||
| Function |
May mediate the control of various cellular processes by insulin. When phosphorylated by the insulin receptor binds specifically to various cellular proteins containing SH2 domains such as phosphatidylinositol 3-kinase p85 subunit or GRB2. Activates phosphatidylinositol 3-kinase when bound to the regulatory p85 subunit (By similarity).
Click to Show/Hide
|
||||
| Uniprot ID | |||||
| Ensembl ID | |||||
| HGNC ID | |||||
| Click to Show/Hide the Complete Species Lineage | |||||
Type(s) of Resistant Mechanism of This Molecule
 EADR: Epigenetic Alteration of DNA, RNA or Protein
 UAPP: Unusual Activation of Pro-survival Pathway
Drug Resistance Data Categorized by Drug
Approved Drug(s)
4 drug(s) in total
| Drug Resistance Data Categorized by Their Corresponding Mechanisms | ||||
|
Unusual Activation of Pro-survival Pathway (UAPP)
|
||||
| Disease Class: Colon cancer [ICD-11: 2B90.1] | [1] | |||
| Resistant Disease | Colon cancer [ICD-11: 2B90.1] | |||
| Resistant Drug | Oxaliplatin | |||
| Molecule Alteration | Expression | Down-regulation |
||
| Differential expression of the molecule in resistant disease | ||||
| Classification of Disease | Colon cancer [ICD-11: 2B90] | |||
| The Specified Disease | Colon cancer | |||
| The Studied Tissue | Colon tissue | |||
| The Expression Level of Disease Section Compare with the Healthy Individual Tissue | p-value: 2.83E-01 Fold-change: -1.37E-01 Z-score: -1.08E+00 |
|||
| Experimental Note | Identified from the Human Clinical Data | |||
| Cell Pathway Regulation | Cell apoptosis | Activation | hsa04210 | |
| Cell invasion | Regulation | N.A. | ||
| Cell proliferation | Inhibition | hsa05200 | ||
| In Vitro Model | SW480 cells | Colon | Homo sapiens (Human) | CVCL_0546 |
| 293T cells | Breast | Homo sapiens (Human) | CVCL_0063 | |
| Experiment for Molecule Alteration |
Western blot analysis | |||
| Experiment for Drug Resistance |
MTT assay | |||
| Mechanism Description | Over-expression of miR-126 in colon cancer cell was able to inhibit cell proliferation, promote cell apoptosis and reduce the invasive ability. miR-126 significantly enhanced the sensitivity of the colon cancer cell to chemotherapeutic drug. It has been shown that IRS1, SLC75A and TOM1 were the potential target genes of miR-126 in colon cancer. | |||
| Drug Sensitivity Data Categorized by Their Corresponding Mechanisms | ||||
|
Unusual Activation of Pro-survival Pathway (UAPP)
|
||||
| Disease Class: Gastric cancer [ICD-11: 2B72.1] | [2] | |||
| Sensitive Disease | Gastric cancer [ICD-11: 2B72.1] | |||
| Sensitive Drug | Cisplatin | |||
| Molecule Alteration | Expression | Down-regulation |
||
| Differential expression of the molecule in resistant disease | ||||
| Classification of Disease | Gastric cancer [ICD-11: 2B72] | |||
| The Specified Disease | Gastric cancer | |||
| The Studied Tissue | Gastric tissue | |||
| The Expression Level of Disease Section Compare with the Healthy Individual Tissue | p-value: 4.36E-01 Fold-change: -7.03E-02 Z-score: -9.63E-01 |
|||
| Experimental Note | Revealed Based on the Cell Line Data | |||
| Cell Pathway Regulation | Cell apoptosis | Activation | hsa04210 | |
| Cell proliferation | Inhibition | hsa05200 | ||
| IGF1R/IRS1 signaling pathway | Regulation | N.A. | ||
| In Vitro Model | SGC7901 cells | Gastric | Homo sapiens (Human) | CVCL_0520 |
| Experiment for Molecule Alteration |
Western blot analysis | |||
| Experiment for Drug Resistance |
CCK8 assay; Wound Healing assay; Matrigel transmembrane invasion assay | |||
| Mechanism Description | Enforced miR-1271 expression repressed the protein levels of its targets, inhibited proliferation of SGC7901/DDP cells, and sensitized SGC7901/DDP cells to DDP-induced apoptosis. Overall, on the basis of the results of our study, we proposed that miR-1271 could regulate cisplatin resistance in human gastric cancer cells, at least partially, via targeting the IGF1R/IRS1 pathway. | |||
| Drug Sensitivity Data Categorized by Their Corresponding Mechanisms | ||||
|
Epigenetic Alteration of DNA, RNA or Protein (EADR)
|
||||
| Disease Class: Breast cancer [ICD-11: 2C60.3] | [3] | |||
| Sensitive Disease | Breast cancer [ICD-11: 2C60.3] | |||
| Sensitive Drug | Paclitaxel | |||
| Molecule Alteration | Expression | Down-regulation |
||
| Differential expression of the molecule in resistant disease | ||||
| Classification of Disease | Breast cancer [ICD-11: 2C60] | |||
| The Specified Disease | Breast cancer | |||
| The Studied Tissue | Breast tissue | |||
| The Expression Level of Disease Section Compare with the Healthy Individual Tissue | p-value: 4.48E-38 Fold-change: -1.39E-01 Z-score: -1.40E+01 |
|||
| Experimental Note | Revealed Based on the Cell Line Data | |||
| Cell Pathway Regulation | AKT/ERK signaling pathway | Inhibition | hsa04010 | |
| Cell invasion | Inhibition | hsa05200 | ||
| Cell migration | Inhibition | hsa04670 | ||
| Cell proliferation | Inhibition | hsa05200 | ||
| In Vitro Model | MCF-7 cells | Breast | Homo sapiens (Human) | CVCL_0031 |
| MDA-MB-231 cells | Breast | Homo sapiens (Human) | CVCL_0062 | |
| HEK293T cells | Kidney | Homo sapiens (Human) | CVCL_0063 | |
| MCF10A cells | Breast | Homo sapiens (Human) | CVCL_0598 | |
| In Vivo Model | Nude mouse xenograft model | Mus musculus | ||
| Experiment for Molecule Alteration |
Dual-luciferase reporter assay | |||
| Experiment for Drug Resistance |
CCK8 assay; Wound healing assay; Flow cytometry assay; Caspase-3 Activity Assay | |||
| Mechanism Description | miR30e inhibits tumor growth and chemoresistance via targeting IRS1 in Breast Cancer, by targeting IRS1, miR30e is able to inhibit AkT and ERk1/2 pathways. | |||
| Drug Sensitivity Data Categorized by Their Corresponding Mechanisms | ||||
|
Unusual Activation of Pro-survival Pathway (UAPP)
|
||||
| Disease Class: Pancreatic cancer [ICD-11: 2C10.3] | [4] | |||
| Sensitive Disease | Pancreatic cancer [ICD-11: 2C10.3] | |||
| Sensitive Drug | Gemcitabine | |||
| Molecule Alteration | Expression | Down-regulation |
||
| Experimental Note | Revealed Based on the Cell Line Data | |||
| Cell Pathway Regulation | Cell colony | Inhibition | hsa05200 | |
| Cell proliferation | Inhibition | hsa05200 | ||
| SNAI1/IRS1/AKT signaling pathway | Regulation | N.A. | ||
| In Vitro Model | BxPC-3 cells | Pancreas | Homo sapiens (Human) | CVCL_0186 |
| PANC-1 cells | Pancreas | Homo sapiens (Human) | CVCL_0480 | |
| SW1990 cells | Pancreas | Homo sapiens (Human) | CVCL_1723 | |
| In Vivo Model | BALB/c nude mouse xenograft model | Mus musculus | ||
| Experiment for Molecule Alteration |
Western blot analysis | |||
| Experiment for Drug Resistance |
MTS assay | |||
| Mechanism Description | miR-30a overexpression suppresses cell proliferation, and sensitizes pancreatic cancer cells to gemcitabine and miR-30a overexpression reduced IRS1 and SNAI1 protein level. | |||
Disease- and Tissue-specific Abundances of This Molecule
ICD Disease Classification 02

| Differential expression of molecule in resistant diseases | ||
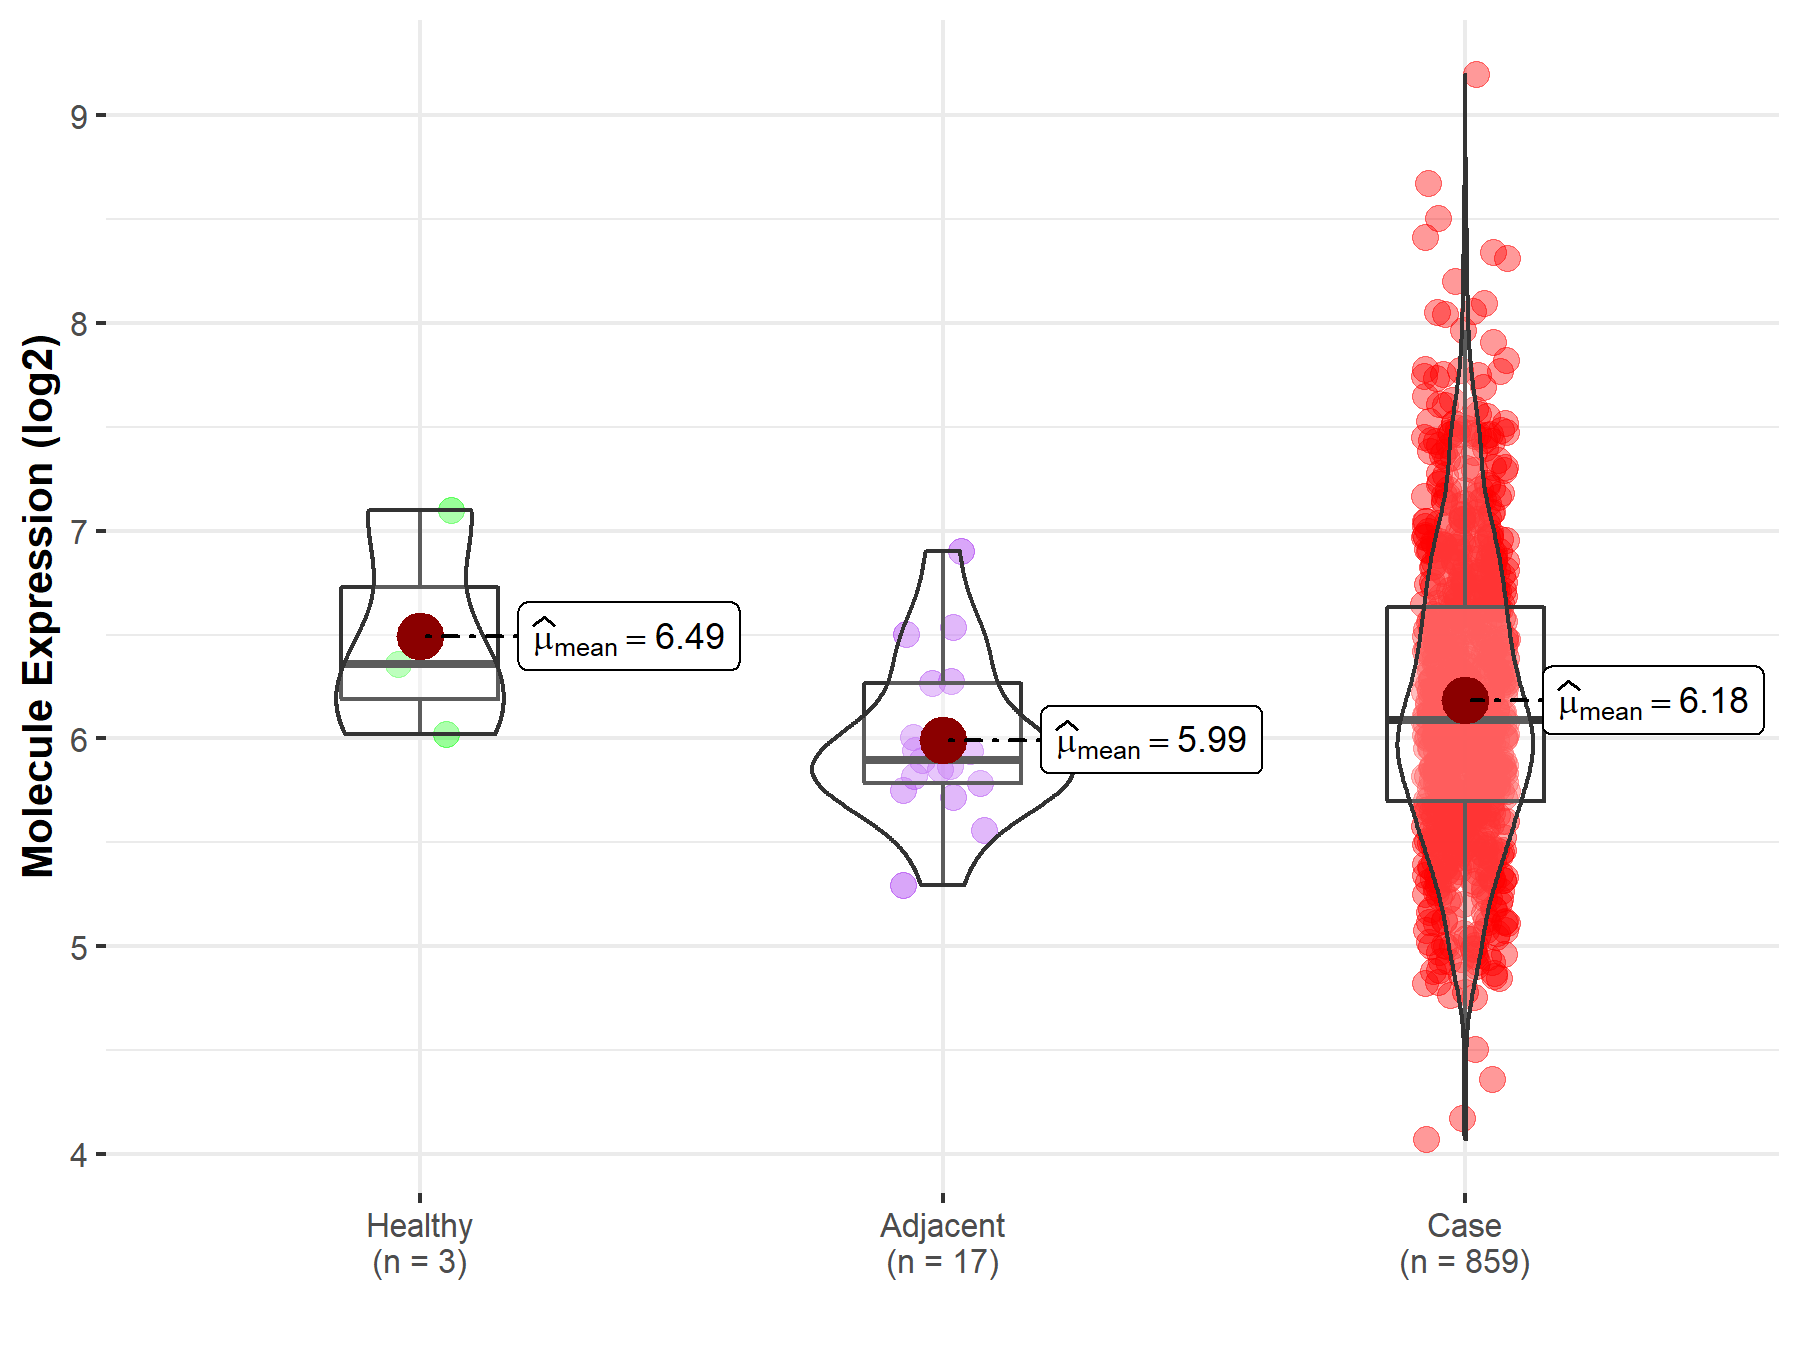
| The Studied Tissue | Gastric tissue | |
| The Specified Disease | Gastric cancer | |
| The Expression Level of Disease Section Compare with the Healthy Individual Tissue | p-value: 4.36E-01; Fold-change: -2.70E-01; Z-score: -4.89E-01 | |
| The Expression Level of Disease Section Compare with the Adjacent Tissue | p-value: 6.92E-02; Fold-change: 1.91E-01; Z-score: 4.86E-01 | |
|
Molecule expression in the normal tissue adjacent to the diseased tissue of patients
Molecule expression in the diseased tissue of patients
Molecule expression in the normal tissue of healthy individuals
|
||
| Disease-specific Molecule Abundances |
|
Click to View the Clearer Original Diagram |
| Differential expression of molecule in resistant diseases | ||
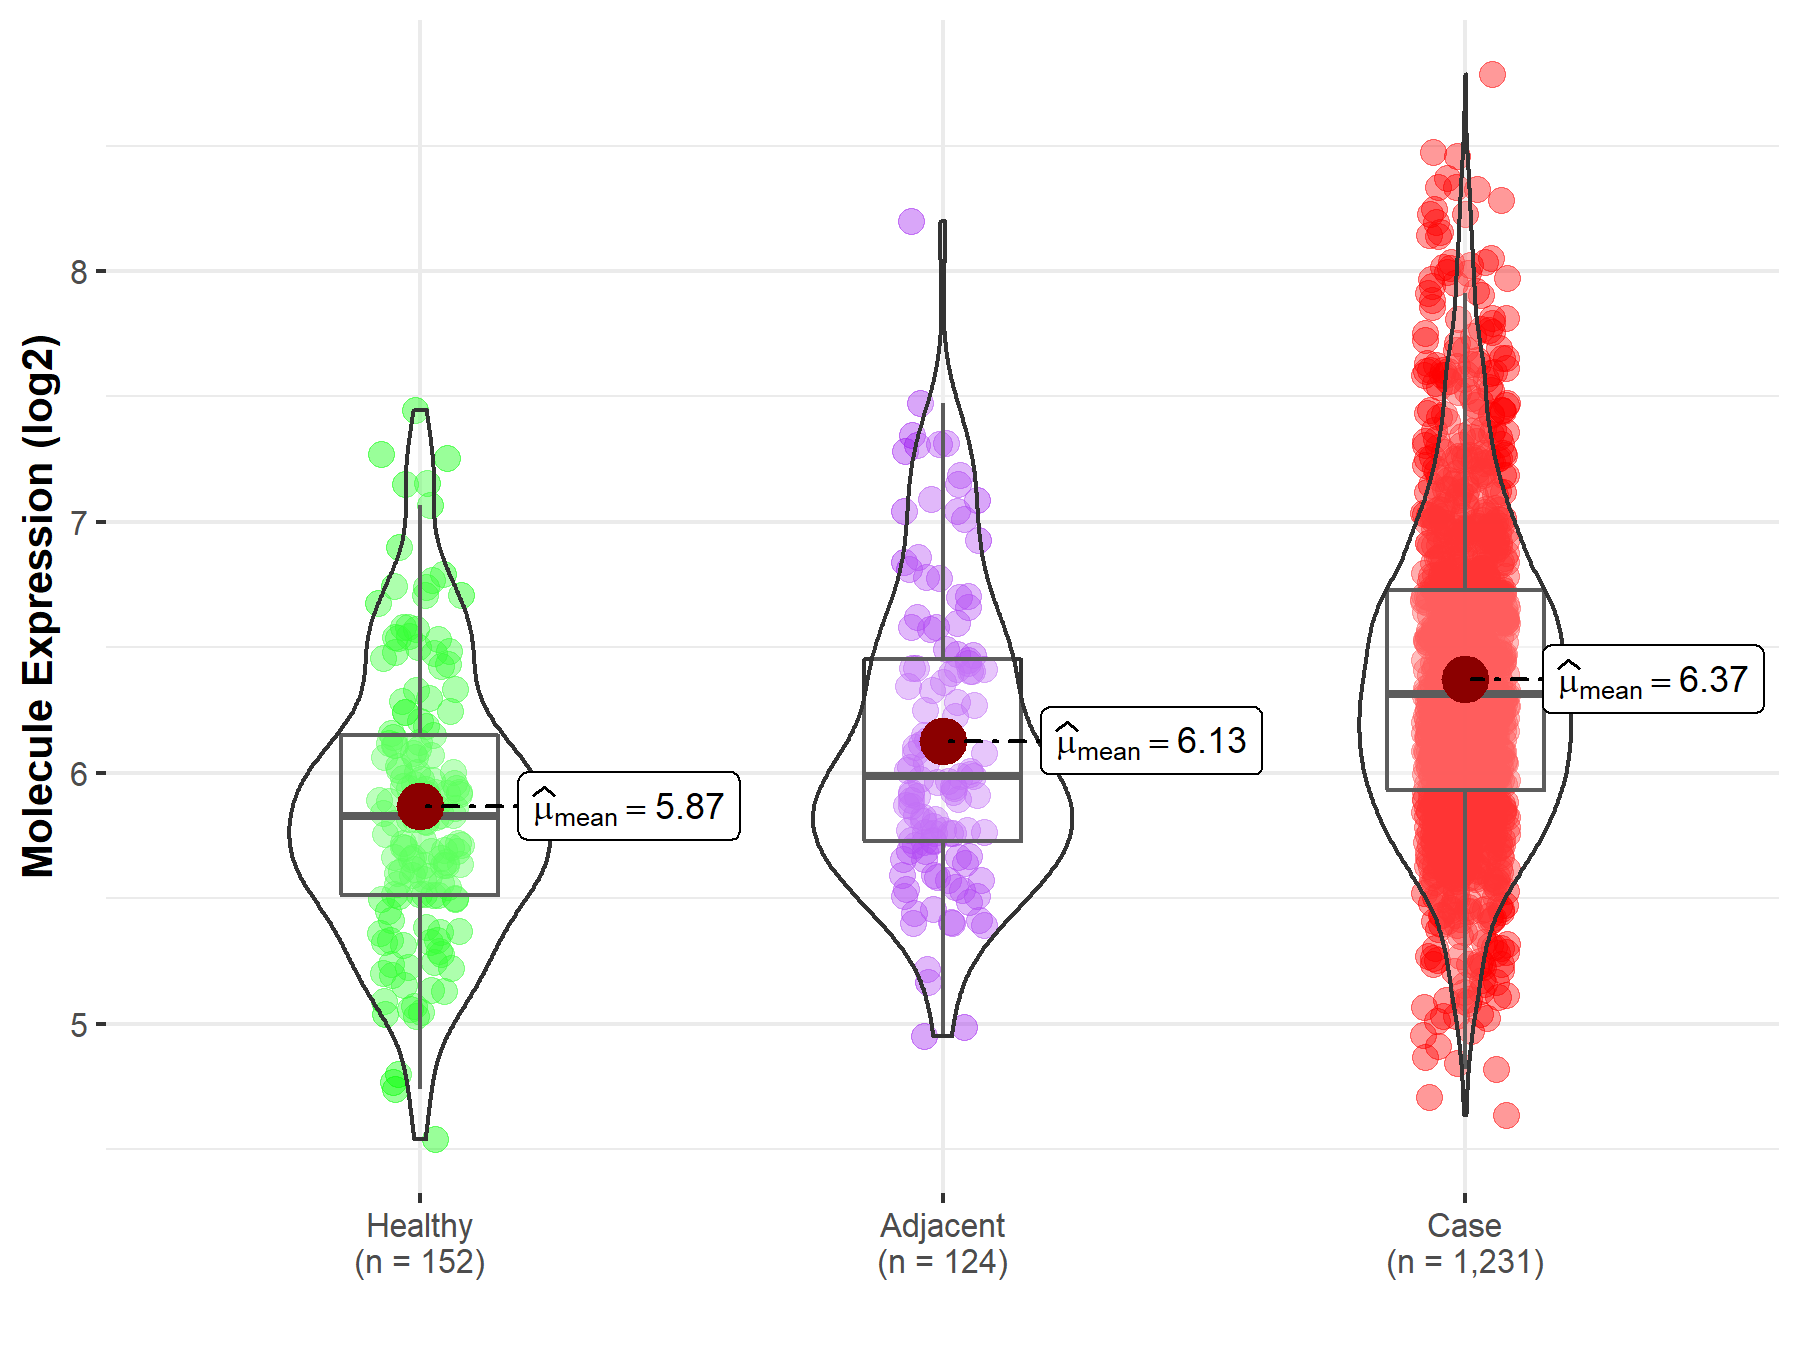
| The Studied Tissue | Colon | |
| The Specified Disease | Colon cancer | |
| The Expression Level of Disease Section Compare with the Healthy Individual Tissue | p-value: 5.28E-21; Fold-change: 4.88E-01; Z-score: 8.91E-01 | |
| The Expression Level of Disease Section Compare with the Adjacent Tissue | p-value: 1.91E-05; Fold-change: 3.27E-01; Z-score: 5.58E-01 | |
|
Molecule expression in the normal tissue adjacent to the diseased tissue of patients
Molecule expression in the diseased tissue of patients
Molecule expression in the normal tissue of healthy individuals
|
||
| Disease-specific Molecule Abundances |
|
Click to View the Clearer Original Diagram |
| Differential expression of molecule in resistant diseases | ||
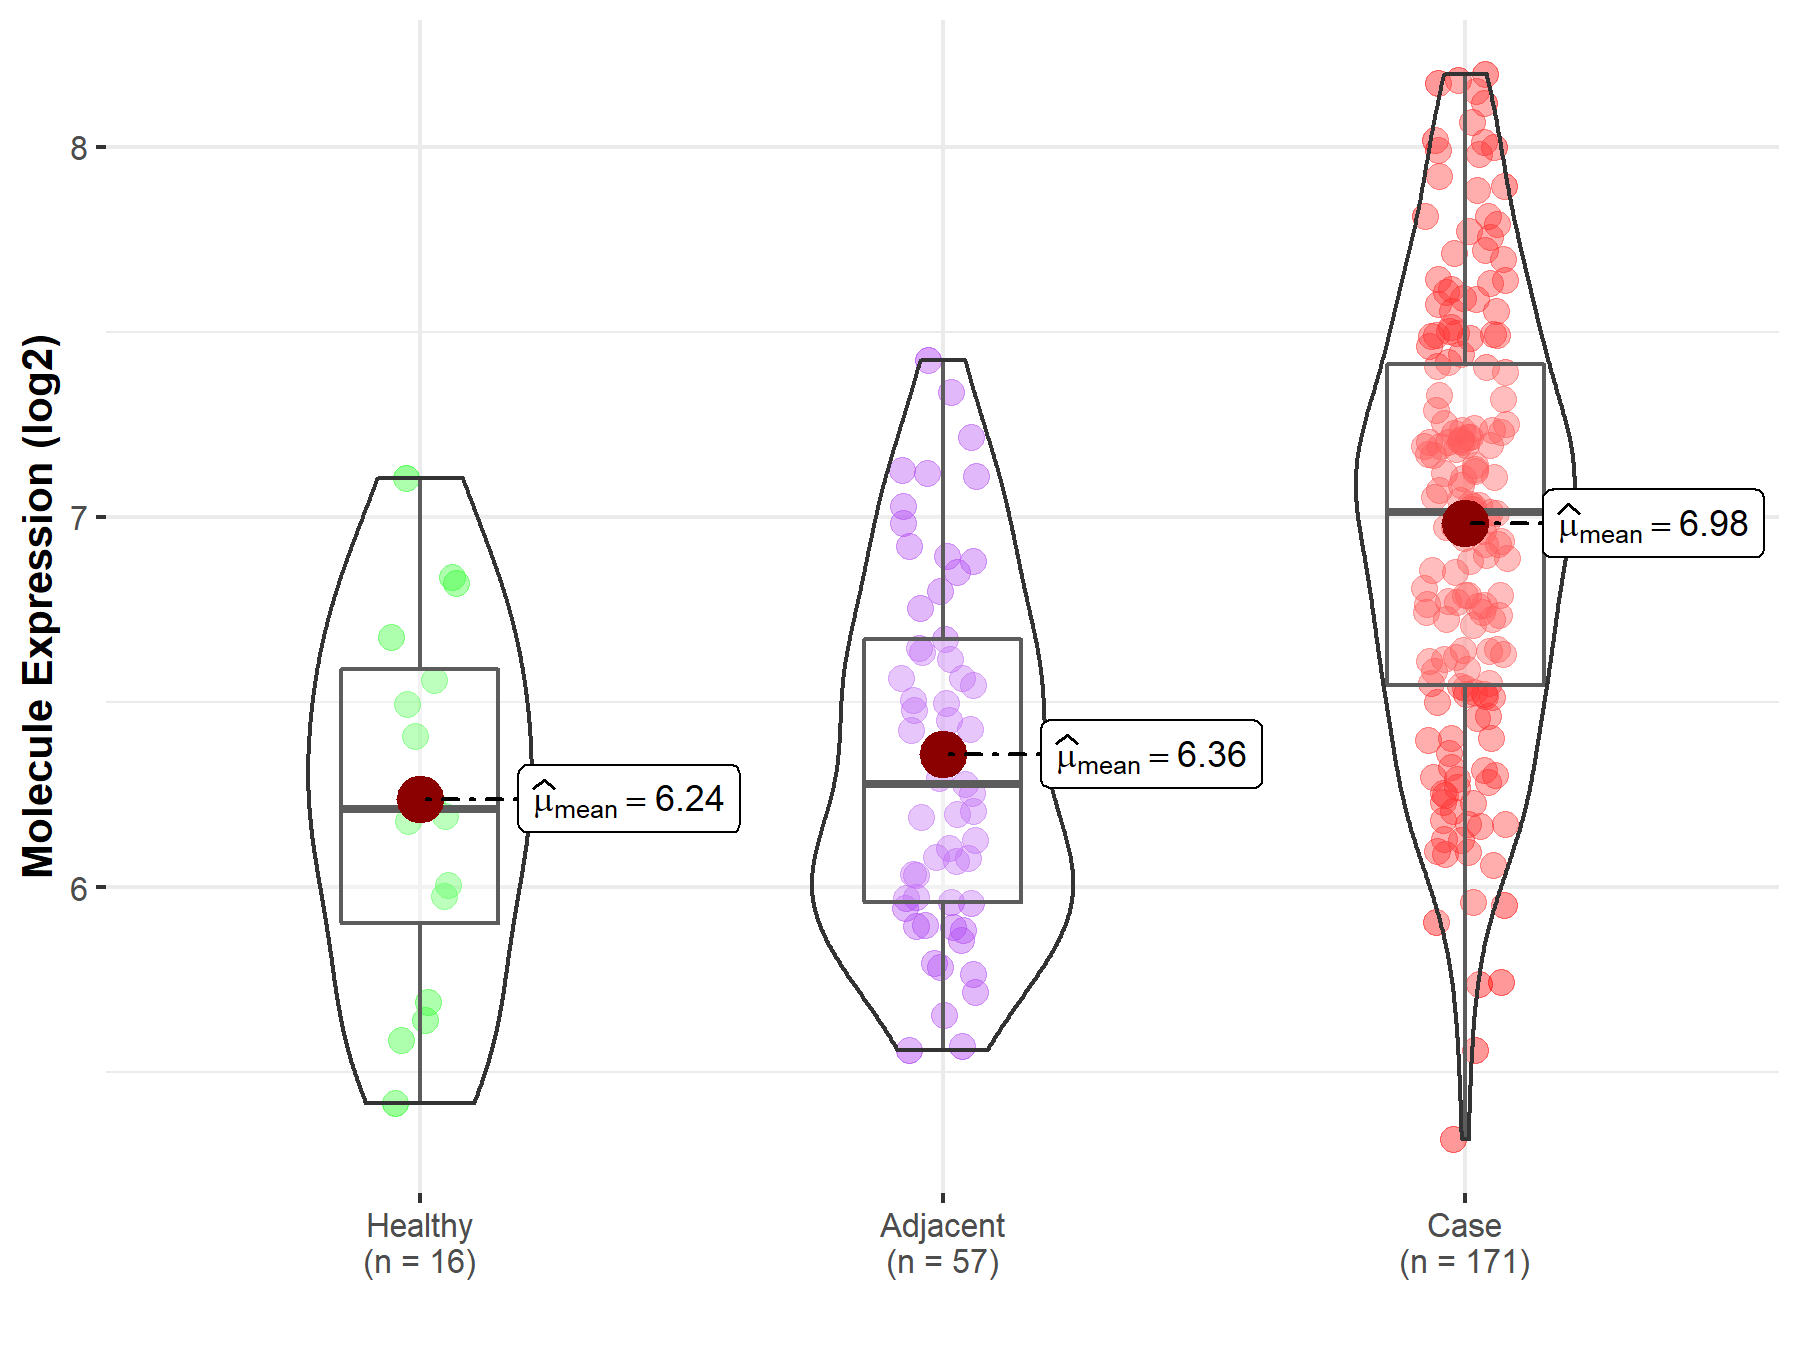
| The Studied Tissue | Pancreas | |
| The Specified Disease | Pancreatic cancer | |
| The Expression Level of Disease Section Compare with the Healthy Individual Tissue | p-value: 2.00E-05; Fold-change: 8.02E-01; Z-score: 1.61E+00 | |
| The Expression Level of Disease Section Compare with the Adjacent Tissue | p-value: 1.49E-12; Fold-change: 7.34E-01; Z-score: 1.52E+00 | |
|
Molecule expression in the normal tissue adjacent to the diseased tissue of patients
Molecule expression in the diseased tissue of patients
Molecule expression in the normal tissue of healthy individuals
|
||
| Disease-specific Molecule Abundances |
|
Click to View the Clearer Original Diagram |
| Differential expression of molecule in resistant diseases | ||
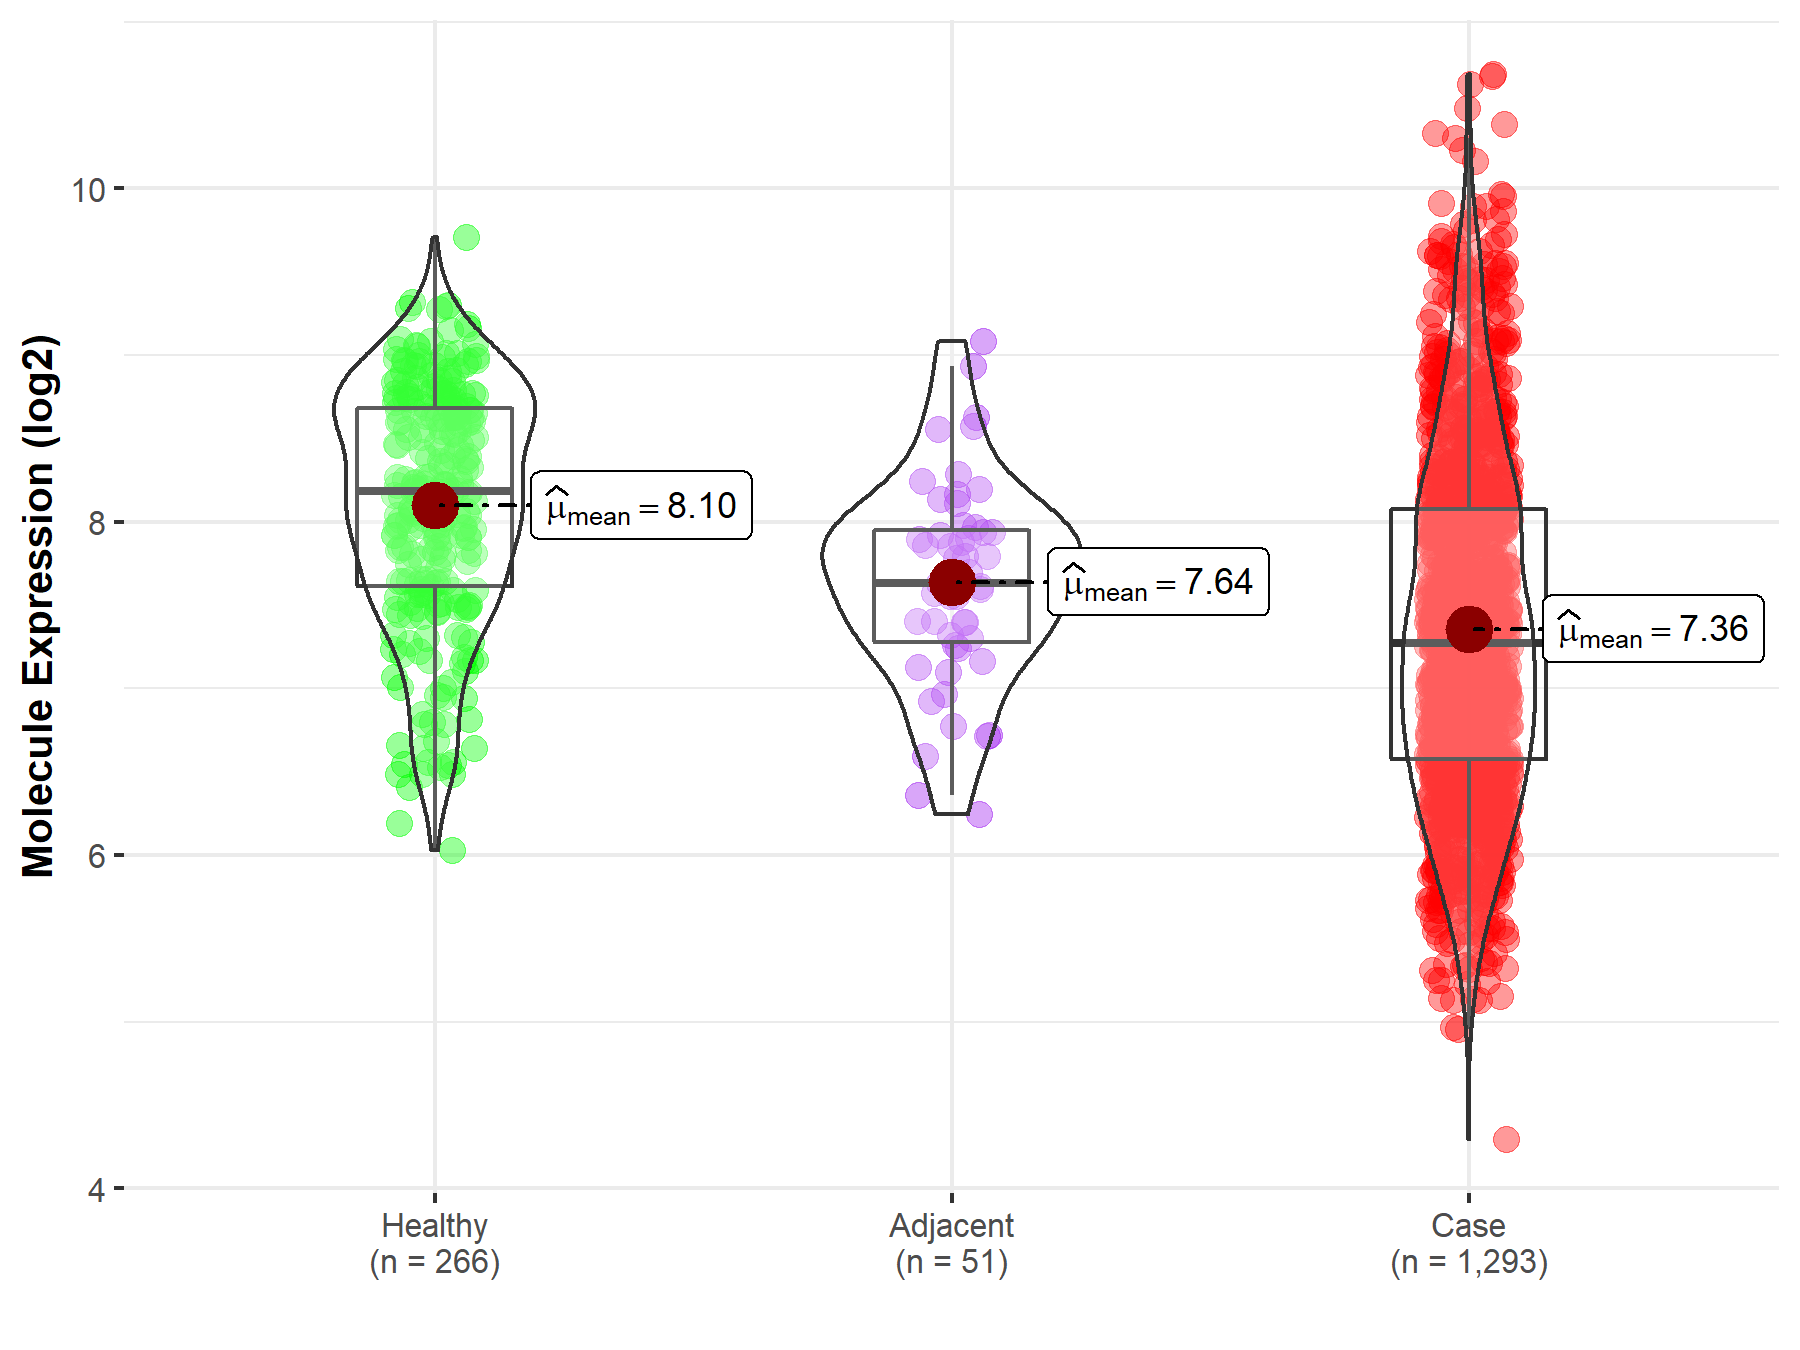
| The Studied Tissue | Breast tissue | |
| The Specified Disease | Breast cancer | |
| The Expression Level of Disease Section Compare with the Healthy Individual Tissue | p-value: 4.48E-38; Fold-change: -9.13E-01; Z-score: -1.27E+00 | |
| The Expression Level of Disease Section Compare with the Adjacent Tissue | p-value: 2.81E-03; Fold-change: -3.60E-01; Z-score: -5.87E-01 | |
|
Molecule expression in the normal tissue adjacent to the diseased tissue of patients
Molecule expression in the diseased tissue of patients
Molecule expression in the normal tissue of healthy individuals
|
||
| Disease-specific Molecule Abundances |
|
Click to View the Clearer Original Diagram |
Tissue-specific Molecule Abundances in Healthy Individuals


|
||
References
If you find any error in data or bug in web service, please kindly report it to Dr. Sun and Dr. Yu.