Molecule Information
General Information of the Molecule (ID: Mol00082)
| Name |
Hypoxia-inducible factor 1-alpha (HIF1A)
,Homo sapiens
|
||||
|---|---|---|---|---|---|
| Synonyms |
HIF-1-alpha; HIF1-alpha; ARNT-interacting protein; Basic-helix-loop-helix-PAS protein MOP1; Class E basic helix-loop-helix protein 78; bHLHe78; Member of PAS protein 1; PAS domain-containing protein 8; BHLHE78; MOP1; PASD8
Click to Show/Hide
|
||||
| Molecule Type |
Protein
|
||||
| Gene Name |
HIF1A
|
||||
| Gene ID | |||||
| Location |
chr14:61695513-61748259[+]
|
||||
| Sequence |
MEGAGGANDKKKISSERRKEKSRDAARSRRSKESEVFYELAHQLPLPHNVSSHLDKASVM
RLTISYLRVRKLLDAGDLDIEDDMKAQMNCFYLKALDGFVMVLTDDGDMIYISDNVNKYM GLTQFELTGHSVFDFTHPCDHEEMREMLTHRNGLVKKGKEQNTQRSFFLRMKCTLTSRGR TMNIKSATWKVLHCTGHIHVYDTNSNQPQCGYKKPPMTCLVLICEPIPHPSNIEIPLDSK TFLSRHSLDMKFSYCDERITELMGYEPEELLGRSIYEYYHALDSDHLTKTHHDMFTKGQV TTGQYRMLAKRGGYVWVETQATVIYNTKNSQPQCIVCVNYVVSGIIQHDLIFSLQQTECV LKPVESSDMKMTQLFTKVESEDTSSLFDKLKKEPDALTLLAPAAGDTIISLDFGSNDTET DDQQLEEVPLYNDVMLPSPNEKLQNINLAMSPLPTAETPKPLRSSADPALNQEVALKLEP NPESLELSFTMPQIQDQTPSPSDGSTRQSSPEPNSPSEYCFYVDSDMVNEFKLELVEKLF AEDTEAKNPFSTQDTDLDLEMLAPYIPMDDDFQLRSFDQLSPLESSSASPESASPQSTVT VFQQTQIQEPTANATTTTATTDELKTVTKDRMEDIKILIASPSPTHIHKETTSATSSPYR DTQSRTASPNRAGKGVIEQTEKSHPRSPNVLSVALSQRTTVPEEELNPKILALQNAQRKR KMEHDGSLFQAVGIGTLLQQPDDHAATTSLSWKRVKGCKSSEQNGMEQKTIILIPSDLAC RLLGQSMDESGLPQLTSYDCEVNAPIQGSRNLLQGEELLRALDQVN Click to Show/Hide
|
||||
| Function |
Functions as a master transcriptional regulator of the adaptive response to hypoxia. Under hypoxic conditions, activates the transcription of over 40 genes, including erythropoietin, glucose transporters, glycolytic enzymes, vascular endothelial growth factor, HILPDA, and other genes whose protein products increase oxygen delivery or facilitate metabolic adaptation to hypoxia. Plays an essential role in embryonic vascularization, tumor angiogenesis and pathophysiology of ischemic disease. Heterodimerizes with ARNT; heterodimer binds to core DNA sequence 5'-TACGTG-3' within the hypoxia response element (HRE) of target gene promoters. Activation requires recruitment of transcriptional coactivators such as CREBBP and EP300. Activity is enhanced by interaction with NCOA1 and/or NCOA2. Interaction with redox regulatory protein APEX1 seems to activate CTAD and potentiates activation by NCOA1 and CREBBP. Involved in the axonal distribution and transport of mitochondria in neurons during hypoxia.
Click to Show/Hide
|
||||
| Uniprot ID | |||||
| Ensembl ID | |||||
| HGNC ID | |||||
| Click to Show/Hide the Complete Species Lineage | |||||
Type(s) of Resistant Mechanism of This Molecule
Drug Resistance Data Categorized by Drug
Approved Drug(s)
4 drug(s) in total
| Drug Resistance Data Categorized by Their Corresponding Mechanisms | ||||
|
|
||||
| Disease Class: Breast cancer [ICD-11: 2C60.3] | [1] | |||
| Resistant Disease | Breast cancer [ICD-11: 2C60.3] | |||
| Resistant Drug | Tamoxifen | |||
| Molecule Alteration | Expression | Up-regulation |
||
| Differential expression of the molecule in resistant disease | ||||
| Classification of Disease | Breast cancer [ICD-11: 2C60] | |||
| The Specified Disease | Breast cancer | |||
| The Studied Tissue | Breast tissue | |||
| The Expression Level of Disease Section Compare with the Healthy Individual Tissue | p-value: 2.47E-15 Fold-change: 4.39E-02 Z-score: 8.20E+00 |
|||
| Experimental Note | Revealed Based on the Cell Line Data | |||
| In Vitro Model | MCF-7 cells | Breast | Homo sapiens (Human) | CVCL_0031 |
| BT474 cells | Breast | Homo sapiens (Human) | CVCL_0179 | |
| LCC2 cells | Breast | Homo sapiens (Human) | CVCL_DP51 | |
| LCC9 cells | Breast | Homo sapiens (Human) | CVCL_DP52 | |
| Experiment for Molecule Alteration |
Western blot analysis | |||
| Experiment for Drug Resistance |
CCK8 assay; Soft agar colony formation assay; Flow cytometry assay | |||
| Mechanism Description | Long non-coding RNA UCA1 enhances tamoxifen resistance in breast cancer cells through a miR18a-HIF1alpha feedback regulatory loop. The upregulated UCA1 sponges miR18a, which is a negative regulator of HIF1alpha. | |||
| Drug Resistance Data Categorized by Their Corresponding Mechanisms | ||||
|
|
||||
| Disease Class: Gastric cancer [ICD-11: 2B72.1] | [2] | |||
| Resistant Disease | Gastric cancer [ICD-11: 2B72.1] | |||
| Resistant Drug | Cisplatin | |||
| Molecule Alteration | Expression | Up-regulation |
||
| Differential expression of the molecule in resistant disease | ||||
| Classification of Disease | Gastric cancer [ICD-11: 2B72] | |||
| The Specified Disease | Gastric cancer | |||
| The Studied Tissue | Gastric tissue | |||
| The Expression Level of Disease Section Compare with the Healthy Individual Tissue | p-value: 5.09E-02 Fold-change: 1.37E-01 Z-score: 4.22E+00 |
|||
| Experimental Note | Identified from the Human Clinical Data | |||
| Cell Pathway Regulation | Cell apoptosis | Inhibition | hsa04210 | |
| mTOR/HIF-1alpha /P-gp/MRP1 signaling pathway | Regulation | N.A. | ||
| In Vitro Model | SGC7901 cells | Gastric | Homo sapiens (Human) | CVCL_0520 |
| BGC823 cells | Gastric | Homo sapiens (Human) | CVCL_3360 | |
| Experiment for Molecule Alteration |
Western blot analysis | |||
| Experiment for Drug Resistance |
CCK8 assay; Flow cytometry assay | |||
| Mechanism Description | Overexpression of long non-coding RNA PVT1 in gastric cancer cells promotes the development of multidrug resistance.PVT-1 was highly expressed in gastric cancer tissues of cisplatin-resistant patients and cisplatin-resistant cells. While, PVT1 overexpression exhibit the anti-apoptotic property in BGC823 and SGC7901 cells transfected with LV-PVT1-GFP and treated with cisplatin. Moreover, qRT-PCR and western blotting revealed that PVT1 up-regulation increased the expression of MDR1, MRP, mTOR and HIF-1alpha. Overexpression of LncRNA PVT1 in gastric carcinoma promotes the development of MDR, suggesting an efficacious target for reversing MDR in gastric cancer therapy. | |||
| Disease Class: Gastric cancer [ICD-11: 2B72.1] | [3] | |||
| Resistant Disease | Gastric cancer [ICD-11: 2B72.1] | |||
| Resistant Drug | Cisplatin | |||
| Molecule Alteration | Expression | Up-regulation |
||
| Experimental Note | Identified from the Human Clinical Data | |||
| Cell Pathway Regulation | Cell invasion | Activation | hsa05200 | |
| Cell proliferation | Activation | hsa05200 | ||
| In Vitro Model | BGC-823 cells | Gastric | Homo sapiens (Human) | CVCL_3360 |
| AGS cells | Gastric | Homo sapiens (Human) | CVCL_0139 | |
| SGC-7921 cells | Gastric | Homo sapiens (Human) | N.A. | |
| Experiment for Molecule Alteration |
Western blot analysis | |||
| Experiment for Drug Resistance |
MTT assay | |||
| Mechanism Description | PVT1 knockdown suppressed the HIF-1alpha mRNA and protein expression levels of HIF-1alpha in BGC-823 cells, PVT1 promoted the HIF-1alpha expression by regulating miR186. | |||
| Drug Sensitivity Data Categorized by Their Corresponding Mechanisms | ||||
|
|
||||
| Disease Class: Ovarian cancer [ICD-11: 2C73.0] | [4] | |||
| Sensitive Disease | Ovarian cancer [ICD-11: 2C73.0] | |||
| Sensitive Drug | Cisplatin | |||
| Molecule Alteration | Expression | Down-regulation |
||
| Experimental Note | Revealed Based on the Cell Line Data | |||
| Cell Pathway Regulation | Cell apoptosis | Activation | hsa04210 | |
| Cell proliferation | Inhibition | hsa05200 | ||
| In Vitro Model | A2780 cells | Ovary | Homo sapiens (Human) | CVCL_0134 |
| PEO1 cells | Ovary | Homo sapiens (Human) | CVCL_2686 | |
| PEO4 cells | Ovary | Homo sapiens (Human) | CVCL_2690 | |
| A2780/CP cells | Ovary | Homo sapiens (Human) | CVCL_A5PS | |
| Experiment for Molecule Alteration |
Western blot analysis | |||
| Experiment for Drug Resistance |
MTT assay | |||
| Mechanism Description | Downregulating hypoxia-inducible factor-1 (HIF-1), which regulates metabolic enzymes involved in glycolysis, is a promising strategy for overcoming cisplatin resistance of human ovarian cancer cells. We found that cisplatin downregulated the level of the regulatable alpha subunit of HIF-1, HIF-1alpha, in cisplatin-sensitive ovarian cancer cells through enhancing HIF-1alpha degradation but did not downregulate HIF-1alpha in their cisplatin-resistant counterparts. Overexpression of a degradation-resistant HIF-1alpha (HIF-1alpha detaODD) reduced cisplatin-induced apoptosis in cisplatin-sensitive cells, whereas genetic knockdown of HIF-1alpha or pharmacological promotion of HIF-1alpha degradation enhanced response to cisplatin in both cisplatin-sensitive and cisplatin-resistant ovarian cancer cells. | |||
| Drug Resistance Data Categorized by Their Corresponding Mechanisms | ||||
|
|
||||
| Disease Class: Cervical cancer [ICD-11: 2C77.0] | [5] | |||
| Metabolic Type | Glucose metabolism | |||
| Resistant Disease | Cervical cancer [ICD-11: 2C77.0] | |||
| Resistant Drug | Docetaxel | |||
| Molecule Alteration | Expression | Up-regulation |
||
| Experimental Note | Revealed Based on the Cell Line Data | |||
| In Vitro Model | Hela cells | Cervix uteri | Homo sapiens (Human) | CVCL_0030 |
| Parental HeLa cells | Cervix | Homo sapiens (Human) | CVCL_0030 | |
| Experiment for Drug Resistance |
IC50 assay | |||
| Mechanism Description | Warburg effect activated HIF1-alpha-mediated signaling-induced autophagic pathway may have an important role in paclitaxel chemoresistance. | |||
| Drug Sensitivity Data Categorized by Their Corresponding Mechanisms | ||||
|
|
||||
| Disease Class: Hepatocellular cancer [ICD-11: 2C12.4] | [6] | |||
| Sensitive Disease | Hepatocellular cancer [ICD-11: 2C12.4] | |||
| Sensitive Drug | Sorafenib | |||
| Molecule Alteration | Expression | Down-regulation |
||
| Experimental Note | Revealed Based on the Cell Line Data | |||
| Cell Pathway Regulation | Cell apoptosis | Activation | hsa04210 | |
| Cell proliferation | Inhibition | hsa05200 | ||
| HIF signaling signaling pathway | Inhibition | hsa04066 | ||
| In Vitro Model | Huh-7 cells | Liver | Homo sapiens (Human) | CVCL_0336 |
| BEL-7402 cells | Liver | Homo sapiens (Human) | CVCL_5492 | |
| HepG2 cells | Liver | Homo sapiens (Human) | CVCL_0027 | |
| Hep3B cells | Liver | Homo sapiens (Human) | CVCL_0326 | |
| SMMC7721 cells | Uterus | Homo sapiens (Human) | CVCL_0534 | |
| L02 cells | Liver | Homo sapiens (Human) | CVCL_6926 | |
| Experiment for Molecule Alteration |
Western blot analysis | |||
| Experiment for Drug Resistance |
MTT assay; Flow cytometry assay | |||
| Mechanism Description | Overexpression of miR-338-3p inhibited HIF-1alpha 3'-UTR luciferase activity and HIF-1alpha protein levels in HepG2, SMMC-7721, and Huh7 cells. miR-338-3p significantly reduced cell viability and induced cell apoptosis of HCC cells. Additionally, HIF-1alpha overexpression rescued and HIF-1alpha knock-down abrogated the anti-HCC activity of miR-338-3p. Furthermore, miR-338-3p sensitized HCC cells to sorafenib in vitro and in a HCC subcutaneous nude mice tumor model by inhibiting HIF-1alpha. Collectively, miR-338-3p inhibits HCC tumor growth and sensitizes HCC cells to sorafenib by down-regulating HIF-1alpha. | |||
Disease- and Tissue-specific Abundances of This Molecule
ICD Disease Classification 02

| Differential expression of molecule in resistant diseases | ||
| The Studied Tissue | Gastric tissue | |
| The Specified Disease | Gastric cancer | |
| The Expression Level of Disease Section Compare with the Healthy Individual Tissue | p-value: 5.09E-02; Fold-change: 1.25E+00; Z-score: 2.88E+00 | |
| The Expression Level of Disease Section Compare with the Adjacent Tissue | p-value: 1.82E-04; Fold-change: 4.13E-01; Z-score: 1.17E+00 | |
|
Molecule expression in the normal tissue adjacent to the diseased tissue of patients
Molecule expression in the diseased tissue of patients
Molecule expression in the normal tissue of healthy individuals
|
||
| Disease-specific Molecule Abundances |

|
Click to View the Clearer Original Diagram |
| Differential expression of molecule in resistant diseases | ||
| The Studied Tissue | Liver | |
| The Specified Disease | Liver cancer | |
| The Expression Level of Disease Section Compare with the Healthy Individual Tissue | p-value: 3.28E-01; Fold-change: 3.36E-01; Z-score: 5.12E-01 | |
| The Expression Level of Disease Section Compare with the Adjacent Tissue | p-value: 9.48E-01; Fold-change: 2.26E-02; Z-score: 5.16E-02 | |
| The Expression Level of Disease Section Compare with the Other Disease Section | p-value: 3.91E-02; Fold-change: 3.62E-01; Z-score: 2.08E+00 | |
|
Molecule expression in the normal tissue adjacent to the diseased tissue of patients
Molecule expression in the diseased tissue of patients
Molecule expression in the normal tissue of healthy individuals
Molecule expression in tissue other than the diseased tissue of patients
|
||
| Disease-specific Molecule Abundances |

|
Click to View the Clearer Original Diagram |
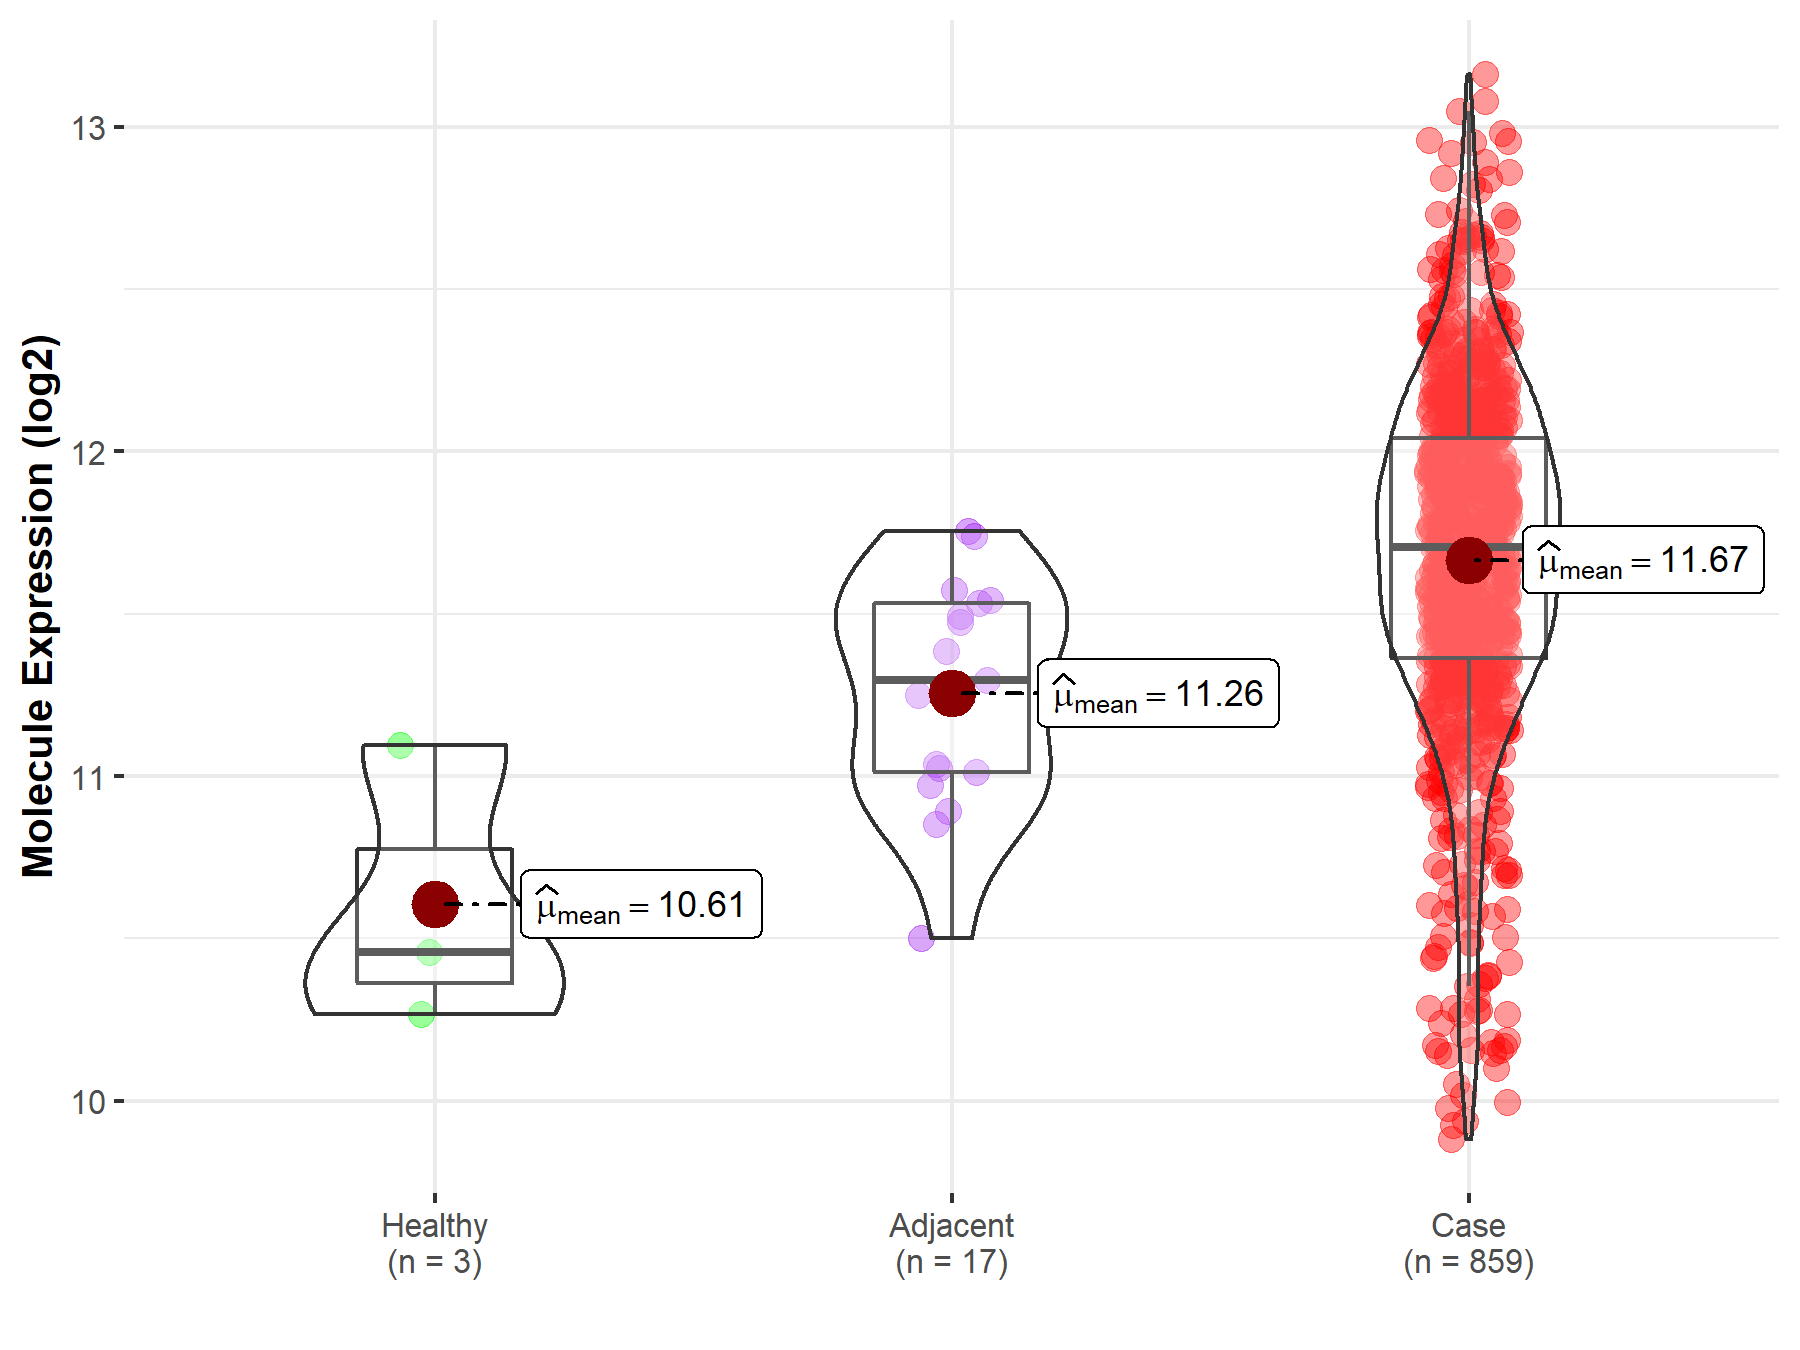
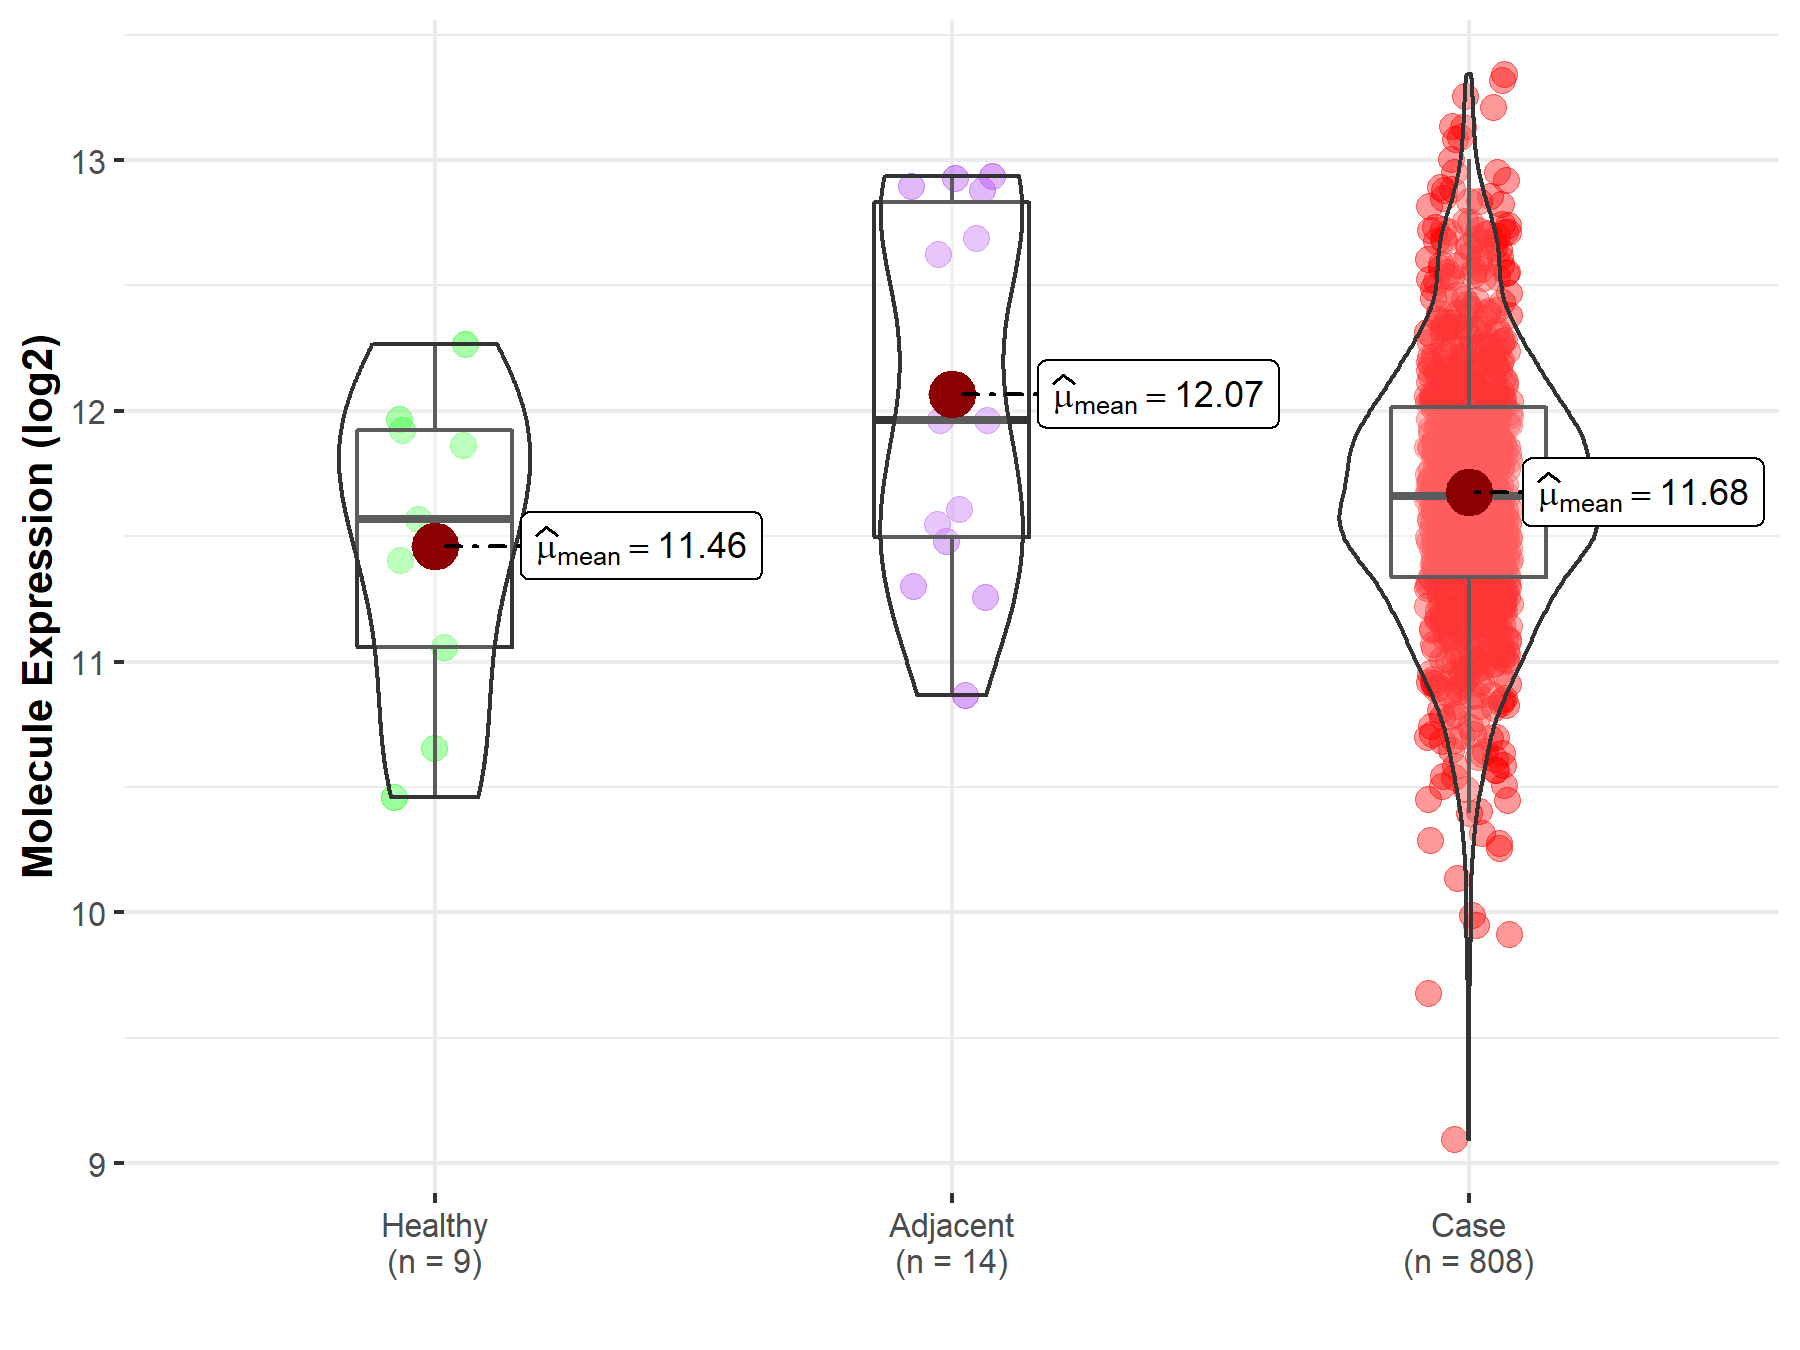
| Differential expression of molecule in resistant diseases | ||
| The Studied Tissue | Breast tissue | |
| The Specified Disease | Breast cancer | |
| The Expression Level of Disease Section Compare with the Healthy Individual Tissue | p-value: 2.47E-15; Fold-change: 4.47E-01; Z-score: 7.52E-01 | |
| The Expression Level of Disease Section Compare with the Adjacent Tissue | p-value: 1.09E-03; Fold-change: 3.98E-01; Z-score: 4.44E-01 | |
|
Molecule expression in the normal tissue adjacent to the diseased tissue of patients
Molecule expression in the diseased tissue of patients
Molecule expression in the normal tissue of healthy individuals
|
||
| Disease-specific Molecule Abundances |

|
Click to View the Clearer Original Diagram |
| Differential expression of molecule in resistant diseases | ||
| The Studied Tissue | Ovary | |
| The Specified Disease | Ovarian cancer | |
| The Expression Level of Disease Section Compare with the Healthy Individual Tissue | p-value: 3.37E-01; Fold-change: 9.06E-02; Z-score: 1.45E-01 | |
| The Expression Level of Disease Section Compare with the Adjacent Tissue | p-value: 6.94E-02; Fold-change: -3.04E-01; Z-score: -4.13E-01 | |
|
Molecule expression in the normal tissue adjacent to the diseased tissue of patients
Molecule expression in the diseased tissue of patients
Molecule expression in the normal tissue of healthy individuals
|
||
| Disease-specific Molecule Abundances |

|
Click to View the Clearer Original Diagram |
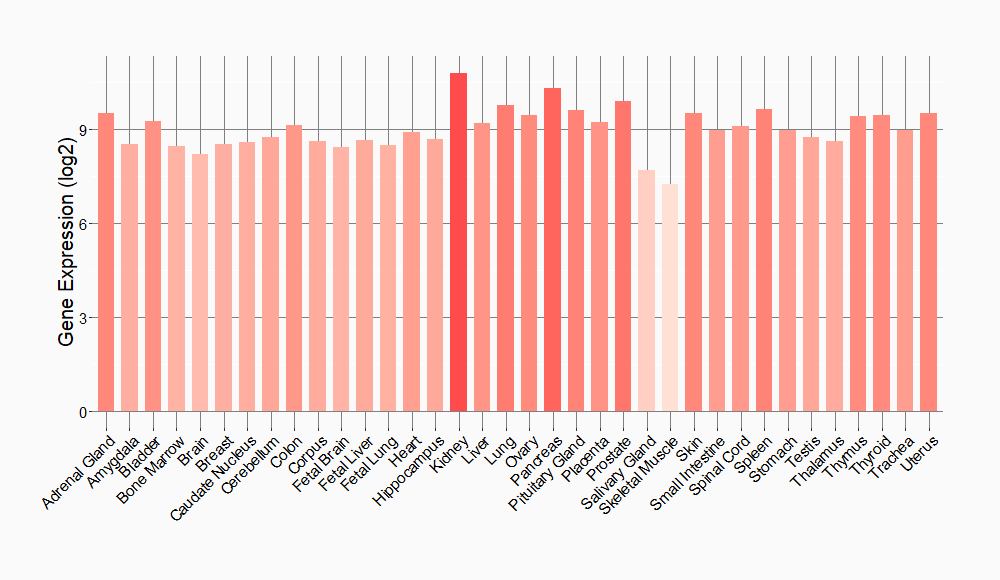
Tissue-specific Molecule Abundances in Healthy Individuals


|
||
References
If you find any error in data or bug in web service, please kindly report it to Dr. Sun and Dr. Yu.
