Molecule Information
General Information of the Molecule (ID: Mol00019)
| Name |
Ubiquitin-like modifier-activating enzyme ATG7 (ATG7)
,Homo sapiens
|
||||
|---|---|---|---|---|---|
| Synonyms |
ATG12-activating enzyme E1 ATG7; Autophagy-related protein 7; APG7-like; hAGP7; Ubiquitin-activating enzyme E1-like protein; APG7L
Click to Show/Hide
|
||||
| Molecule Type |
Protein
|
||||
| Gene Name |
ATG7
|
||||
| Gene ID | |||||
| Location |
chr3:11272309-11557665[+]
|
||||
| Sequence |
MAAATGDPGLSKLQFAPFSSALDVGFWHELTQKKLNEYRLDEAPKDIKGYYYNGDSAGLP
ARLTLEFSAFDMSAPTPARCCPAIGTLYNTNTLESFKTADKKLLLEQAANEIWESIKSGT ALENPVLLNKFLLLTFADLKKYHFYYWFCYPALCLPESLPLIQGPVGLDQRFSLKQIEAL ECAYDNLCQTEGVTALPYFLIKYDENMVLVSLLKHYSDFFQGQRTKITIGVYDPCNLAQY PGWPLRNFLVLAAHRWSSSFQSVEVVCFRDRTMQGARDVAHSIIFEVKLPEMAFSPDCPK AVGWEKNQKGGMGPRMVNLSECMDPKRLAESSVDLNLKLMCWRLVPTLDLDKVVSVKCLL LGAGTLGCNVARTLMGWGVRHITFVDNAKISYSNPVRQPLYEFEDCLGGGKPKALAAADR LQKIFPGVNARGFNMSIPMPGHPVNFSSVTLEQARRDVEQLEQLIESHDVVFLLMDTRES RWLPAVIAASKRKLVINAALGFDTFVVMRHGLKKPKQQGAGDLCPNHPVASADLLGSSLF ANIPGYKLGCYFCNDVVAPGDSTRDRTLDQQCTVSRPGLAVIAGALAVELMVSVLQHPEG GYAIASSSDDRMNEPPTSLGLVPHQIRGFLSRFDNVLPVSLAFDKCTACSSKVLDQYERE GFNFLAKVFNSSHSFLEDLTGLTLLHQETQAAEIWDMSDDETI Click to Show/Hide
|
||||
| Function |
E1-like activating enzyme involved in the 2 ubiquitin-like systems required for cytoplasm to vacuole transport (Cvt) and autophagy. Activates ATG12 for its conjugation with ATG5 as well as the ATG8 family proteins for their conjugation with phosphatidylethanolamine. Both systems are needed for the ATG8 association to Cvt vesicles and autophagosomes membranes. Required for autophagic death induced by caspase-8 inhibition. Required for mitophagy which contributes to regulate mitochondrial quantity and quality by eliminating the mitochondria to a basal level to fulfill cellular energy requirements and preventing excess ROS production. Modulates p53/TP53 activity to regulate cell cycle and survival during metabolic stress. Plays also a key role in the maintenance of axonal homeostasis, the prevention of axonal degeneration, the maintenance of hematopoietic stem cells, the formation of Paneth cell granules, as well as in adipose differentiation. Plays a role in regulating the liver clock and glucose metabolism by mediating the autophagic degradation of CRY1 (clock repressor) in a time-dependent manner (By similarity).
Click to Show/Hide
|
||||
| Uniprot ID | |||||
| Ensembl ID | |||||
| HGNC ID | |||||
| Click to Show/Hide the Complete Species Lineage | |||||
Type(s) of Resistant Mechanism of This Molecule
Drug Resistance Data Categorized by Drug
Approved Drug(s)
4 drug(s) in total
| Drug Sensitivity Data Categorized by Their Corresponding Mechanisms | ||||
|
|
||||
| Disease Class: Glioblastoma [ICD-11: 2A00.02] | [1] | |||
| Sensitive Disease | Glioblastoma [ICD-11: 2A00.02] | |||
| Sensitive Drug | Temozolomide | |||
| Molecule Alteration | Expression | Up-regulation |
||
| Differential expression of the molecule in resistant disease | ||||
| Classification of Disease | Brain cancer [ICD-11: 2A00] | |||
| The Specified Disease | Glioma | |||
| The Studied Tissue | White matter | |||
| The Expression Level of Disease Section Compare with the Healthy Individual Tissue | p-value: 4.60E-02 Fold-change: 9.83E-02 Z-score: 2.14E+00 |
|||
| Experimental Note | Revealed Based on the Cell Line Data | |||
| Cell Pathway Regulation | Cell autophagy | Activation | hsa04140 | |
| In Vitro Model | T98G cells | Brain | Homo sapiens (Human) | CVCL_0556 |
| U373-MG | Brain | Homo sapiens (Human) | CVCL_2219 | |
| Experiment for Molecule Alteration |
Immunoblotting analysis | |||
| Experiment for Drug Resistance |
Celltiter 96 aqueous one solution cell proliferation assay | |||
| Mechanism Description | ATG7 is a potential target for miR-17, and this miRNA could negatively regulate ATG7 expression, resulting in a modulation of the autophagic status in T98G glioblastoma cells, the autophagy activation by anti-miR-17 resulted in a decrease of the threshold resistance at temozolomide doses in T98G cells. | |||
| Drug Resistance Data Categorized by Their Corresponding Mechanisms | ||||
|
|
||||
| Disease Class: Hepatocellular carcinoma [ICD-11: 2C12.2] | [2] | |||
| Resistant Disease | Hepatocellular carcinoma [ICD-11: 2C12.2] | |||
| Resistant Drug | Cisplatin | |||
| Molecule Alteration | Expression | Up-regulation |
||
| Differential expression of the molecule in resistant disease | ||||
| Classification of Disease | Liver cancer [ICD-11: 2C12] | |||
| The Specified Disease | Liver cancer | |||
| The Studied Tissue | Liver tissue | |||
| The Expression Level of Disease Section Compare with the Healthy Individual Tissue | p-value: 2.50E-08 Fold-change: 5.98E-02 Z-score: 6.40E+00 |
|||
| Experimental Note | Identified from the Human Clinical Data | |||
| Cell Pathway Regulation | Cell proliferation | Activation | hsa05200 | |
| In Vitro Model | Huh-7 cells | Liver | Homo sapiens (Human) | CVCL_0336 |
| HepG2 cells | Liver | Homo sapiens (Human) | CVCL_0027 | |
| Experiment for Molecule Alteration |
Western blot analysis | |||
| Experiment for Drug Resistance |
CCK8 assay | |||
| Mechanism Description | miR-199a-5p levels were significantly decreased in HCC patients treated with cisplatin-based chemotherapy. Downregulated miR-199a-5p enhanced autophagy activation by targeting ATG7. Cisplatin-induced downregulation of miR-199a-5p increases cell proliferation by activating autophagy. | |||
| Disease Class: Non-small cell lung cancer [ICD-11: 2C25.Y] | [5] | |||
| Resistant Disease | Non-small cell lung cancer [ICD-11: 2C25.Y] | |||
| Resistant Drug | Cisplatin | |||
| Molecule Alteration | Expression | Up-regulation |
||
| Experimental Note | Revealed Based on the Cell Line Data | |||
| Cell Pathway Regulation | Cell autophagy | Activation | hsa04140 | |
| miR17/ATG7 signaling pathway | Regulation | N.A. | ||
| In Vitro Model | A549 cells | Lung | Homo sapiens (Human) | CVCL_0023 |
| H1299 cells | Lung | Homo sapiens (Human) | CVCL_0060 | |
| In Vivo Model | Nude mouse xenograft model | Mus musculus | ||
| Experiment for Molecule Alteration |
Western blot analysis; RT-qPCR | |||
| Experiment for Drug Resistance |
MTT assay | |||
| Mechanism Description | LncRNA BLACAT1 Can enhance ATG7 expression by suppressing miR-17 expression to promote autophagy and cisplatin resistance in non small cell lung cancer through the miR-17/ATG7 signaling pathway. | |||
| Disease Class: Non-small cell lung cancer [ICD-11: 2C25.Y] | [4] | |||
| Resistant Disease | Non-small cell lung cancer [ICD-11: 2C25.Y] | |||
| Resistant Drug | Cisplatin | |||
| Molecule Alteration | Expression | Up-regulation |
||
| Experimental Note | Revealed Based on the Cell Line Data | |||
| Cell Pathway Regulation | Cell autophagy | Inhibition | hsa04140 | |
| In Vitro Model | A549 cells | Lung | Homo sapiens (Human) | CVCL_0023 |
| H1299 cells | Lung | Homo sapiens (Human) | CVCL_0060 | |
| Experiment for Molecule Alteration |
RT-qPCR; Western blot analysis | |||
| Experiment for Drug Resistance |
CCK8 assay | |||
| Mechanism Description | Knockdown of LncRNA-XIST enhances the chemosensitivity of NSCLC cells via suppression of autophagy. LncRNA-XIST inhibits the expression of miR17 to modulate ATG7 and LncRNA-XIST regulates autophagy through ATG7. | |||
| Drug Sensitivity Data Categorized by Their Corresponding Mechanisms | ||||
|
|
||||
| Disease Class: Non-small cell lung cancer [ICD-11: 2C25.Y] | [4] | |||
| Sensitive Disease | Non-small cell lung cancer [ICD-11: 2C25.Y] | |||
| Sensitive Drug | Cisplatin | |||
| Molecule Alteration | Expression | Down-regulation |
||
| Differential expression of the molecule in resistant disease | ||||
| Classification of Disease | Lung cancer [ICD-11: 2C25] | |||
| The Specified Disease | Lung cancer | |||
| The Studied Tissue | Lung tissue | |||
| The Expression Level of Disease Section Compare with the Healthy Individual Tissue | p-value: 1.19E-36 Fold-change: -6.16E-02 Z-score: -1.43E+01 |
|||
| Experimental Note | Revealed Based on the Cell Line Data | |||
| Cell Pathway Regulation | Cell autophagy | Activation | hsa04140 | |
| lncRNA-XIST/miR17 axis | Regulation | N.A. | ||
| In Vitro Model | A549 cells | Lung | Homo sapiens (Human) | CVCL_0023 |
| H1299 cells | Lung | Homo sapiens (Human) | CVCL_0060 | |
| Experiment for Molecule Alteration |
RT-qPCR; Western blot analysis | |||
| Experiment for Drug Resistance |
CCK8 assay | |||
| Mechanism Description | Knockdown of LncRNA-XIST enhances the chemosensitivity of NSCLC cells via suppression of autophagy. LncRNA-XIST inhibits the expression of miR17 to modulate ATG7 and LncRNA-XIST regulates autophagy through ATG7. | |||
| Disease Class: Oral squamous cell carcinoma [ICD-11: 2B6E.0] | [6] | |||
| Sensitive Disease | Oral squamous cell carcinoma [ICD-11: 2B6E.0] | |||
| Sensitive Drug | Cisplatin | |||
| Molecule Alteration | Expression | Down-regulation |
||
| Experimental Note | Revealed Based on the Cell Line Data | |||
| Cell Pathway Regulation | Cell apoptosis | Activation | hsa04210 | |
| Cell autophagy | Inhibition | hsa04140 | ||
| Cell invasion | Inhibition | hsa05200 | ||
| Cell migration | Inhibition | hsa04670 | ||
| Cell proliferation | Inhibition | hsa05200 | ||
| In Vitro Model | CAL-27 cells | Tongue | Homo sapiens (Human) | CVCL_1107 |
| KB cells | Gastric | Homo sapiens (Human) | CVCL_0372 | |
| Experiment for Molecule Alteration |
Western blot analysis | |||
| Experiment for Drug Resistance |
CCK8 assay | |||
| Mechanism Description | After HOTAIR silence, autophagy was inhibited with the downregulated expression of MAP1LC3B (microtubule-associated protein 1 light chain 3B), beclin1, and autophagy-related gene (ATG) 3 and ATG7. The expressions of mTOR increased, which promoted the sensitivity to cisplatin. | |||
| Drug Resistance Data Categorized by Their Corresponding Mechanisms | ||||
|
|
||||
| Disease Class: Bladder cancer [ICD-11: 2C94.0] | [3] | |||
| Resistant Disease | Bladder cancer [ICD-11: 2C94.0] | |||
| Resistant Drug | Sirolimus | |||
| Molecule Alteration | Expression | Down-regulation |
||
| Differential expression of the molecule in resistant disease | ||||
| Classification of Disease | Bladder cancer [ICD-11: 2C94] | |||
| The Specified Disease | Bladder cancer | |||
| The Studied Tissue | Bladder tissue | |||
| The Expression Level of Disease Section Compare with the Healthy Individual Tissue | p-value: 9.18E-02 Fold-change: -2.70E-02 Z-score: -1.91E+00 |
|||
| Experimental Note | Revealed Based on the Cell Line Data | |||
| Cell Pathway Regulation | Cell viability | Activation | hsa05200 | |
| In Vitro Model | 5637 cells | Bladder | Homo sapiens (Human) | CVCL_0126 |
| EJ cells | Bladder | Homo sapiens (Human) | CVCL_UI82 | |
| J82 cells | Bladder | Homo sapiens (Human) | CVCL_0359 | |
| SV-HUC-1 cells | Bladder | Homo sapiens (Human) | CVCL_3798 | |
| T24 cells | Bladder | Homo sapiens (Human) | CVCL_0554 | |
| HT1376 cells | Bladder | Homo sapiens (Human) | CVCL_1292 | |
| In Vivo Model | BALB/c nude mouse xenograft model | Mus musculus | ||
| Experiment for Molecule Alteration |
Western blot analysis | |||
| Experiment for Drug Resistance |
CCK8 assay | |||
| Mechanism Description | UCA1 knockdown suppresses growth, migration, and invasion of T24 and 5637 cells via derepression of miR-582-5p and ATG7 was downregulated by UCA1 shRNA and upregulated by miR-582-5p inhibitor. | |||
| Drug Sensitivity Data Categorized by Their Corresponding Mechanisms | ||||
|
|
||||
| Disease Class: Diabetic retinopathy [ICD-11: 9B71.0] | [7] | |||
| Sensitive Disease | Diabetic retinopathy [ICD-11: 9B71.0] | |||
| Sensitive Drug | Idebenone | |||
| Molecule Alteration | Expression | Down-regulation |
||
| Experimental Note | Revealed Based on the Cell Line Data | |||
| Cell Pathway Regulation | PI3K signaling pathway | Regulation | N.A. | |
| Akt signaling pathway | Regulation | N.A. | ||
| In Vitro Model | RF/6A cells | Chorioretinal | Homo sapiens (Human) | CVCL_4552 |
| In Vivo Model | Diabetic rats model | Rattus norvegicus | ||
| Experiment for Molecule Alteration |
Western blot assay | |||
| Experiment for Drug Resistance |
Ocular fundus ultrasound testing; Histological assay; Cell proliferation assay | |||
| Mechanism Description | IDE regulated the autophagy of retina cells to alleviate diabetic retinopathy via regulating the PI3K signaling pathway.The PI3K/Akt/mTOR signaling pathway acts as the mediator of IDE in alleviating DR.IDE treatment suppressed the activation of the PI3K/Akt/mTOR signaling pathway, and PI3K signaling repressed the protective role of IDE in DR, explaining the IDE-suppressed autophagy in DR. | |||
Investigative Drug(s)
1 drug(s) in total
| Drug Resistance Data Categorized by Their Corresponding Mechanisms | ||||
|
|
||||
| Disease Class: Pancreatic ductal adenocarcinoma [ICD-11: 2C10.0] | [8] | |||
| Resistant Disease | Pancreatic ductal adenocarcinoma [ICD-11: 2C10.0] | |||
| Resistant Drug | 4-(Methylnitrosamino)-1-(3-pyridyl)-1-butanone | |||
| Molecule Alteration | Expression | Down-regulation |
||
| Experimental Note | Revealed Based on the Cell Line Data | |||
| Cell Pathway Regulation | beta2AR-Akt feedback loop signalling pathway | Regulation | N.A. | |
| In Vitro Model | Panc1 cells | Pancreas | Homo sapiens (Human) | CVCL_0480 |
| Experiment for Molecule Alteration |
Western blot assay; qRT-PCR | |||
| Experiment for Drug Resistance |
Colony formation assay; Stem cell sphere formation assay | |||
| Mechanism Description | In this study, we found that NNK promoted stemness and gemcitabine resistance in pancreatic cancer cell lines. Moreover, NNK increased autophagy and elevated the expression levels of the autophagy-related markers autophagy-related gene 5 (ATG5), autophagy-related gene 7 (ATG7), and Beclin1. Furthermore, the results showed that NNK-promoted stemness and gemcitabine resistance was partially dependent on the role of NNK in cell autophagy, which is mediated by the beta2-adrenergic receptor (beta2AR)-Akt axis. Finally, we proved that NNK intervention could not only activate beta2AR, but also increase its expression, making beta2AR and Akt form a feedback loop. Overall, these findings show that the NNK-induced beta2AR-Akt feedback loop promotes stemness and gemcitabine resistance in pancreatic cancer cells. | |||
Disease- and Tissue-specific Abundances of This Molecule
ICD Disease Classification 02

| Differential expression of molecule in resistant diseases | ||
| The Studied Tissue | Nervous tissue | |
| The Specified Disease | Brain cancer | |
| The Expression Level of Disease Section Compare with the Healthy Individual Tissue | p-value: 1.89E-06; Fold-change: -1.62E-01; Z-score: -4.61E-01 | |
|
Molecule expression in the diseased tissue of patients
Molecule expression in the normal tissue of healthy individuals
|
||
| Disease-specific Molecule Abundances |
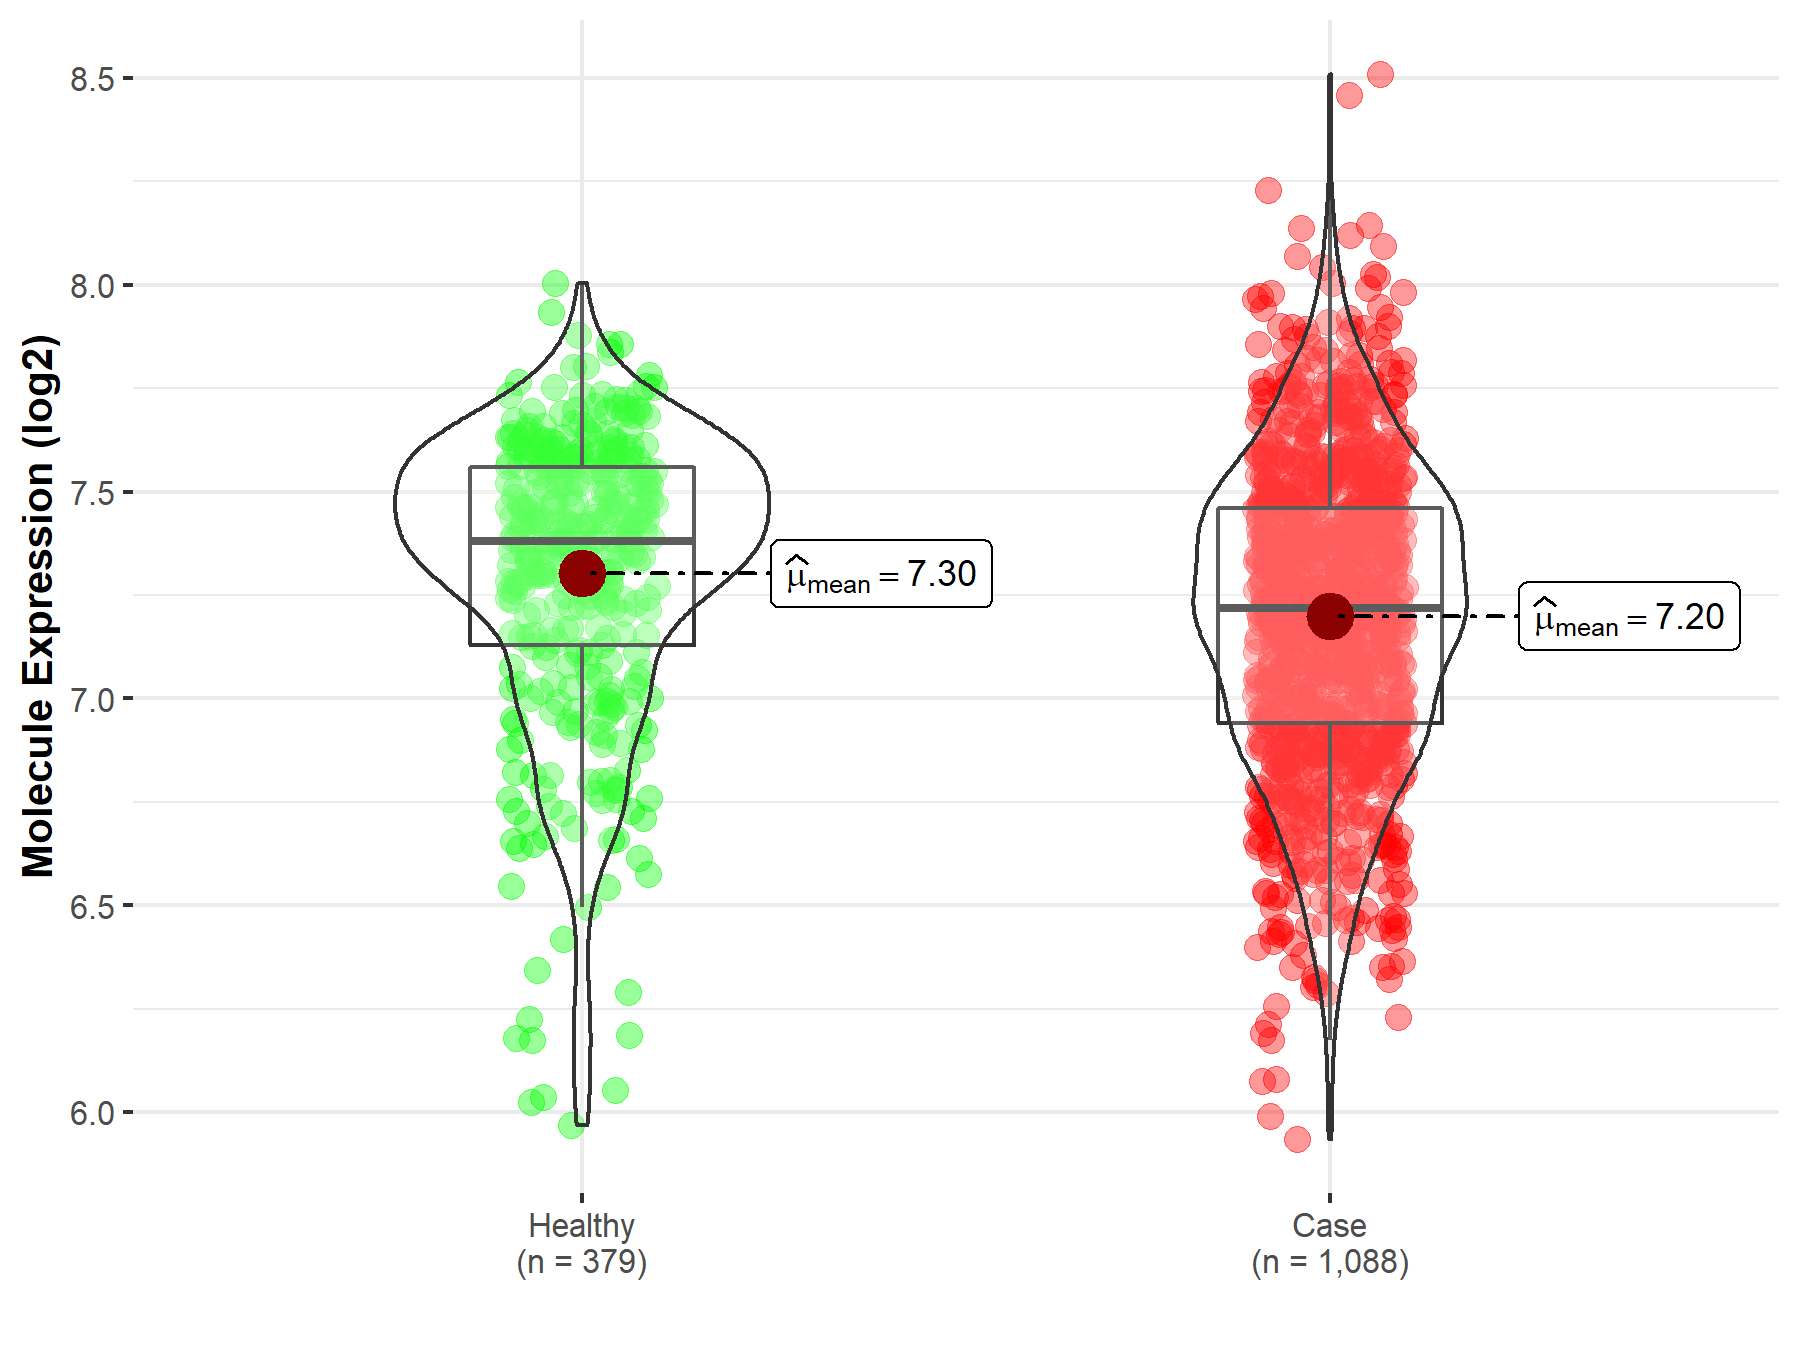
|
Click to View the Clearer Original Diagram |
| The Studied Tissue | Brainstem tissue | |
| The Specified Disease | Glioma | |
| The Expression Level of Disease Section Compare with the Healthy Individual Tissue | p-value: 6.44E-03; Fold-change: -3.12E-01; Z-score: -5.18E+00 | |
|
Molecule expression in the diseased tissue of patients
Molecule expression in the normal tissue of healthy individuals
|
||
| Disease-specific Molecule Abundances |
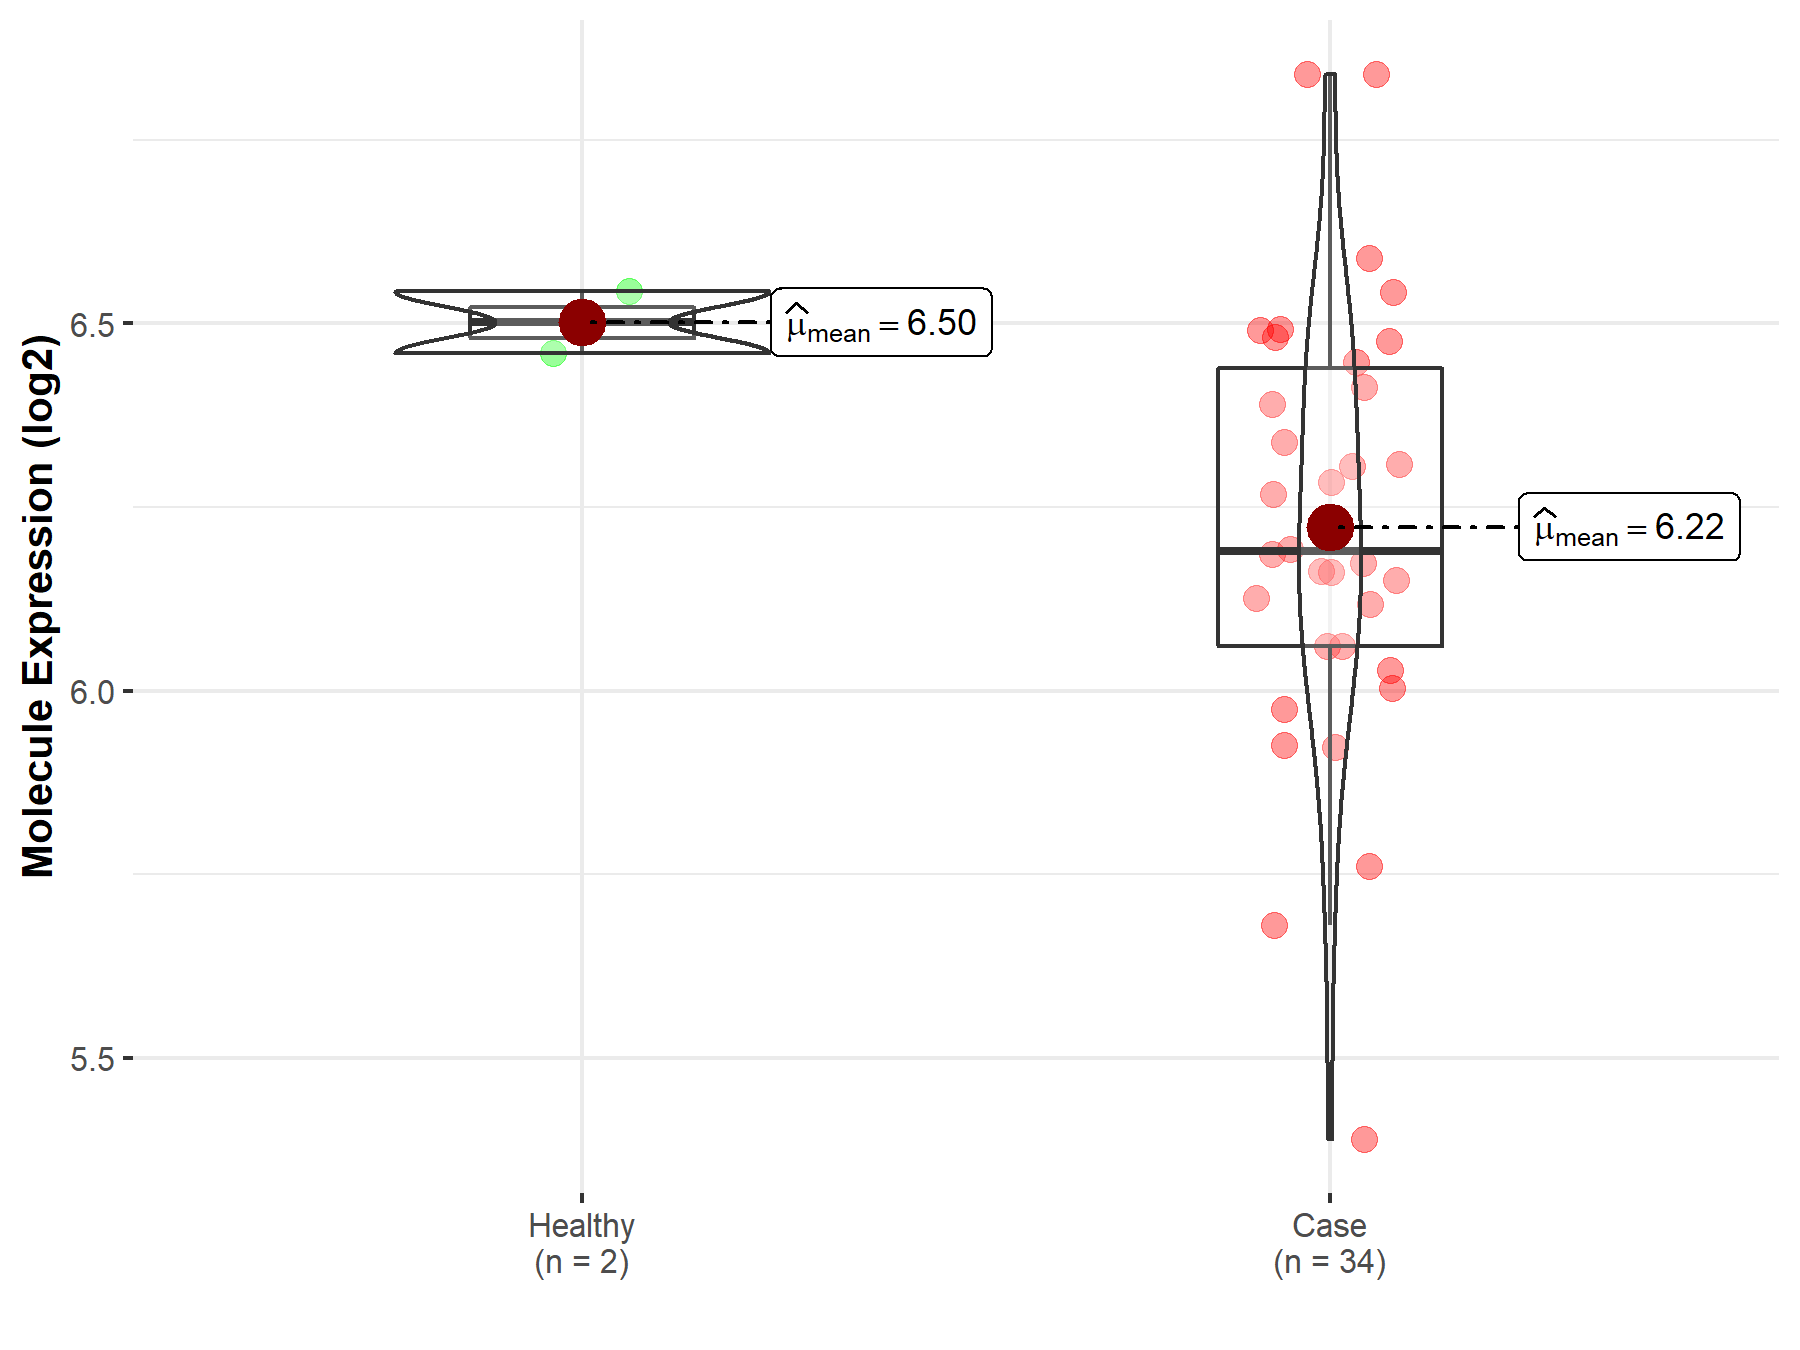
|
Click to View the Clearer Original Diagram |
| The Studied Tissue | White matter | |
| The Specified Disease | Glioma | |
| The Expression Level of Disease Section Compare with the Healthy Individual Tissue | p-value: 4.60E-02; Fold-change: 8.37E-01; Z-score: 1.30E+00 | |
|
Molecule expression in the diseased tissue of patients
Molecule expression in the normal tissue of healthy individuals
|
||
| Disease-specific Molecule Abundances |
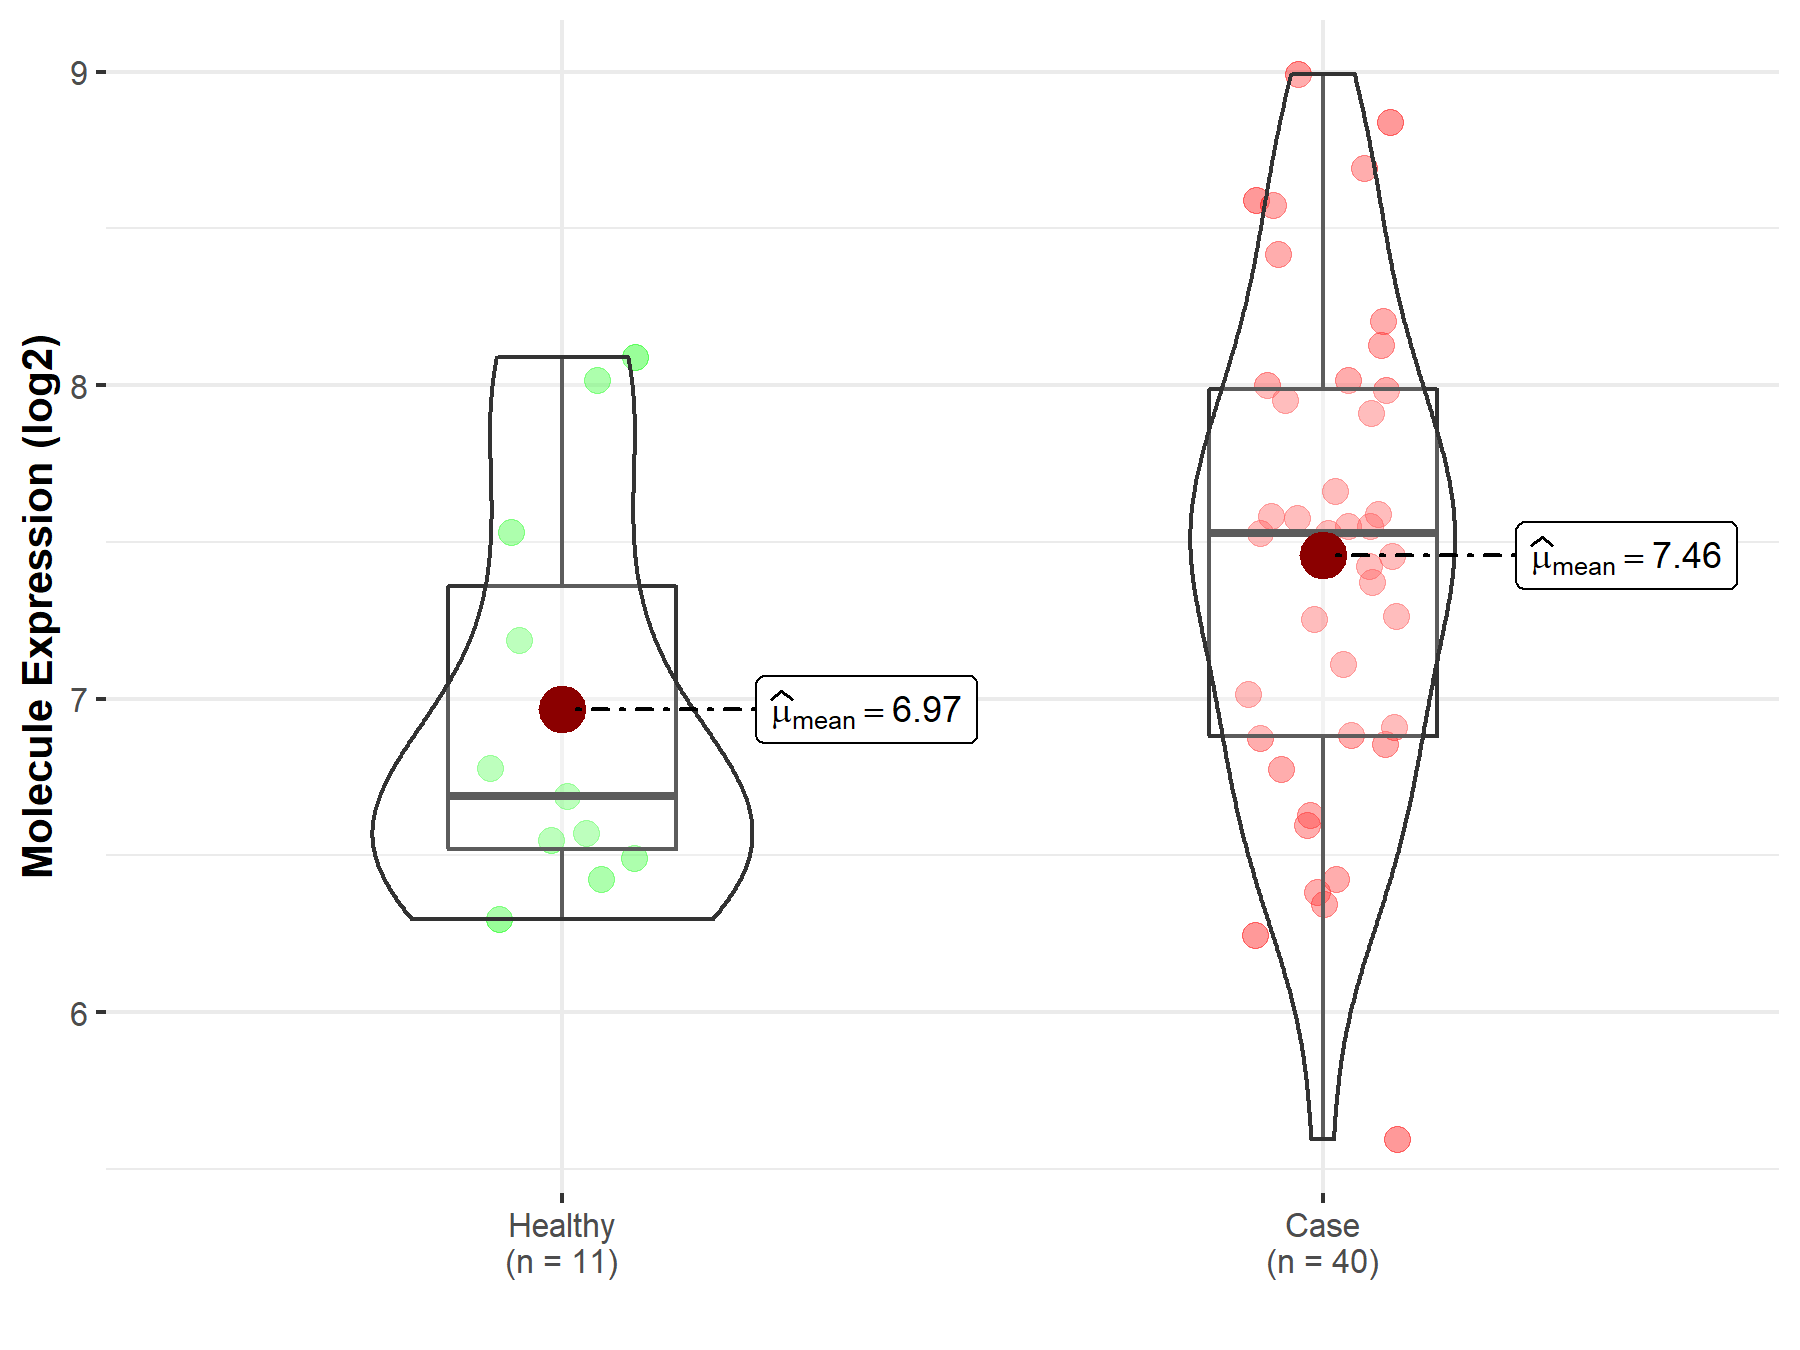
|
Click to View the Clearer Original Diagram |
| The Studied Tissue | Brainstem tissue | |
| The Specified Disease | Neuroectodermal tumor | |
| The Expression Level of Disease Section Compare with the Healthy Individual Tissue | p-value: 7.06E-01; Fold-change: -8.44E-03; Z-score: -2.52E-02 | |
|
Molecule expression in the diseased tissue of patients
Molecule expression in the normal tissue of healthy individuals
|
||
| Disease-specific Molecule Abundances |

|
Click to View the Clearer Original Diagram |
| Differential expression of molecule in resistant diseases | ||
| The Studied Tissue | Oral tissue | |
| The Specified Disease | Oral squamous cell carcinoma | |
| The Expression Level of Disease Section Compare with the Healthy Individual Tissue | p-value: 3.32E-02; Fold-change: 1.55E-01; Z-score: 5.63E-01 | |
| The Expression Level of Disease Section Compare with the Adjacent Tissue | p-value: 4.07E-02; Fold-change: 7.54E-02; Z-score: 3.41E-01 | |
|
Molecule expression in the normal tissue adjacent to the diseased tissue of patients
Molecule expression in the diseased tissue of patients
Molecule expression in the normal tissue of healthy individuals
|
||
| Disease-specific Molecule Abundances |

|
Click to View the Clearer Original Diagram |
| Differential expression of molecule in resistant diseases | ||
| The Studied Tissue | Liver | |
| The Specified Disease | Liver cancer | |
| The Expression Level of Disease Section Compare with the Healthy Individual Tissue | p-value: 2.50E-08; Fold-change: 2.26E-01; Z-score: 9.75E-01 | |
| The Expression Level of Disease Section Compare with the Adjacent Tissue | p-value: 1.92E-30; Fold-change: 2.95E-01; Z-score: 1.34E+00 | |
| The Expression Level of Disease Section Compare with the Other Disease Section | p-value: 5.99E-02; Fold-change: 5.48E-01; Z-score: 1.85E+00 | |
|
Molecule expression in the normal tissue adjacent to the diseased tissue of patients
Molecule expression in the diseased tissue of patients
Molecule expression in the normal tissue of healthy individuals
Molecule expression in tissue other than the diseased tissue of patients
|
||
| Disease-specific Molecule Abundances |
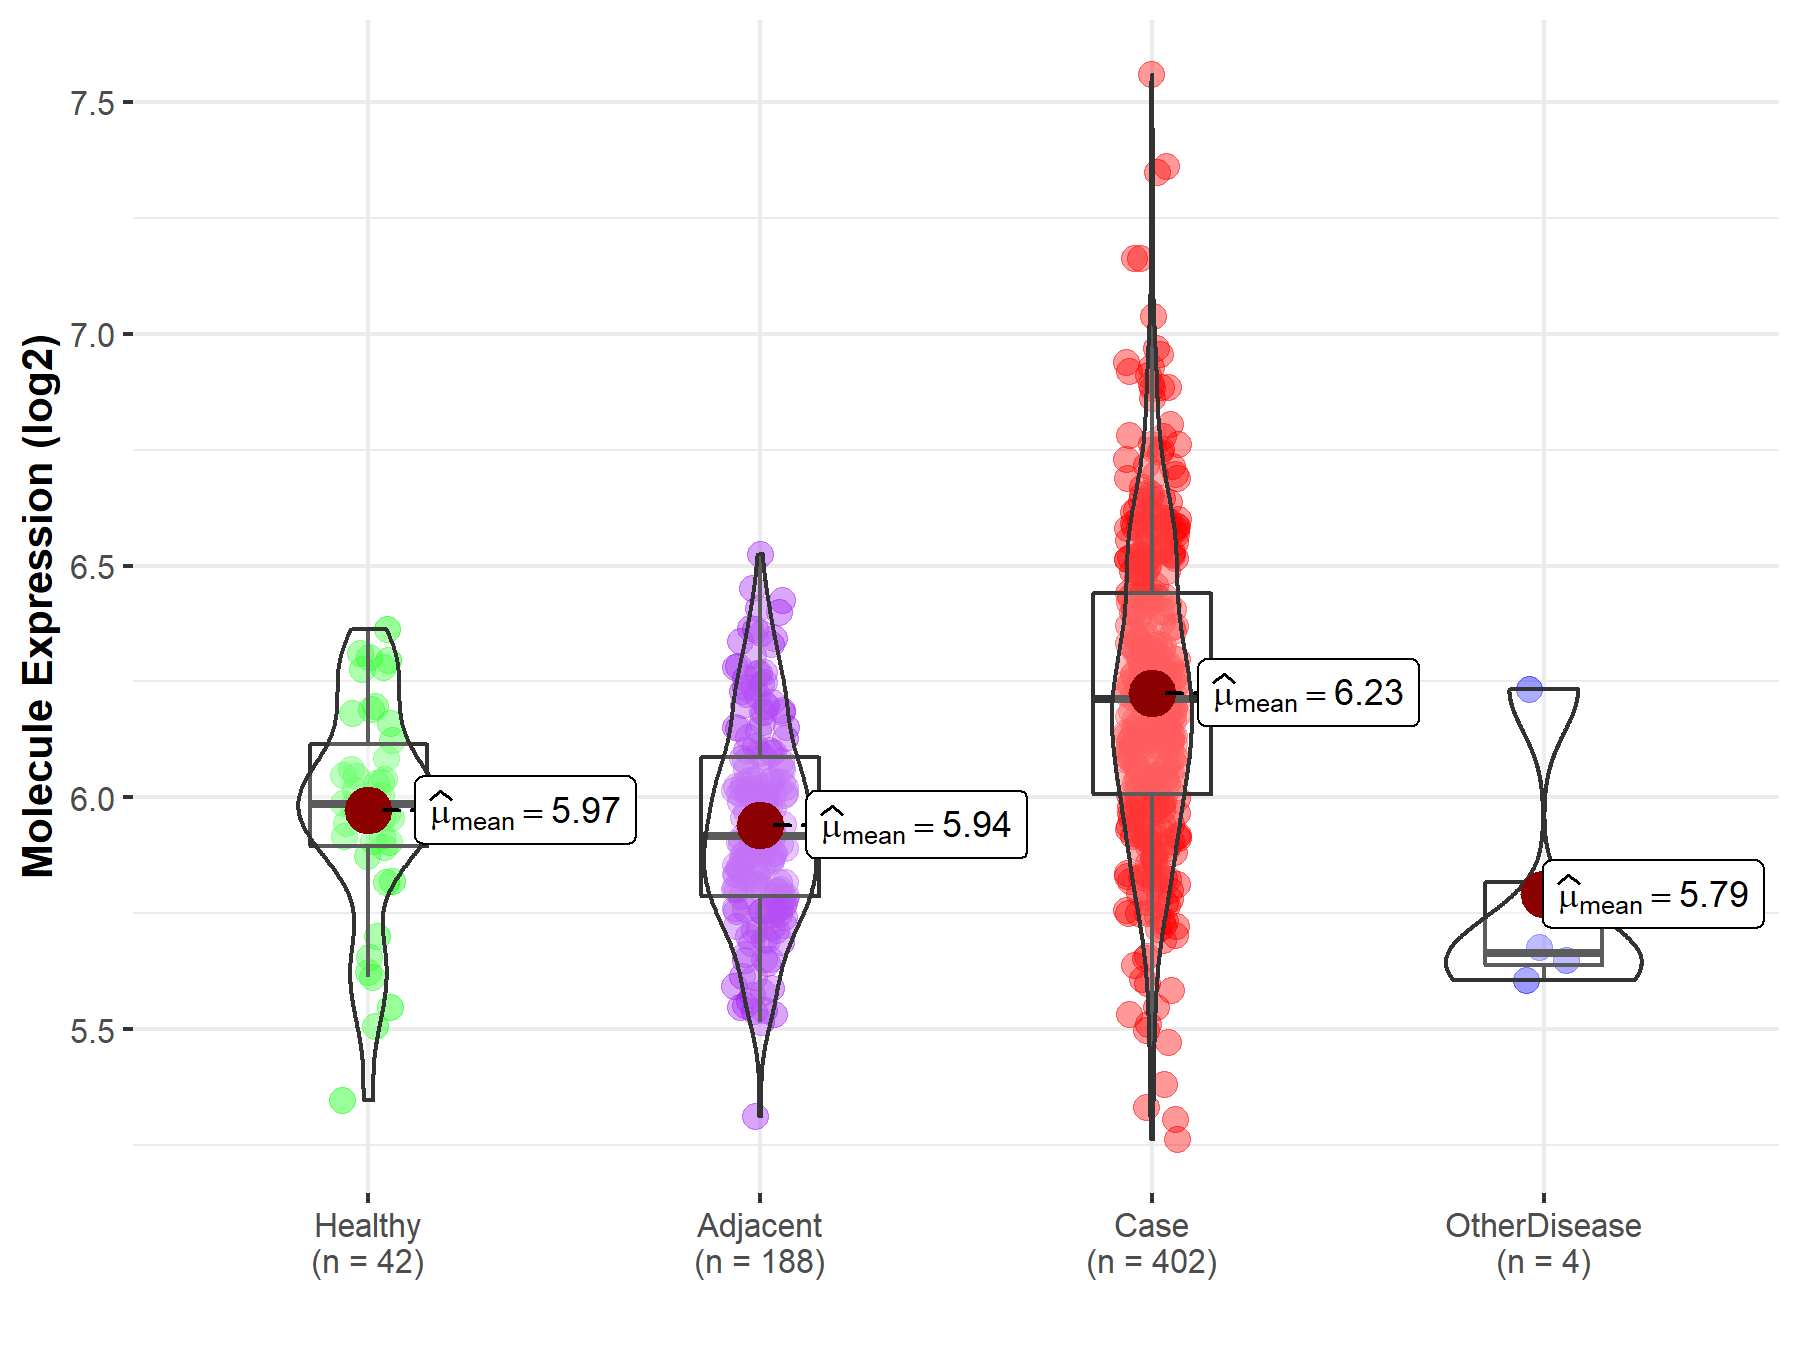
|
Click to View the Clearer Original Diagram |
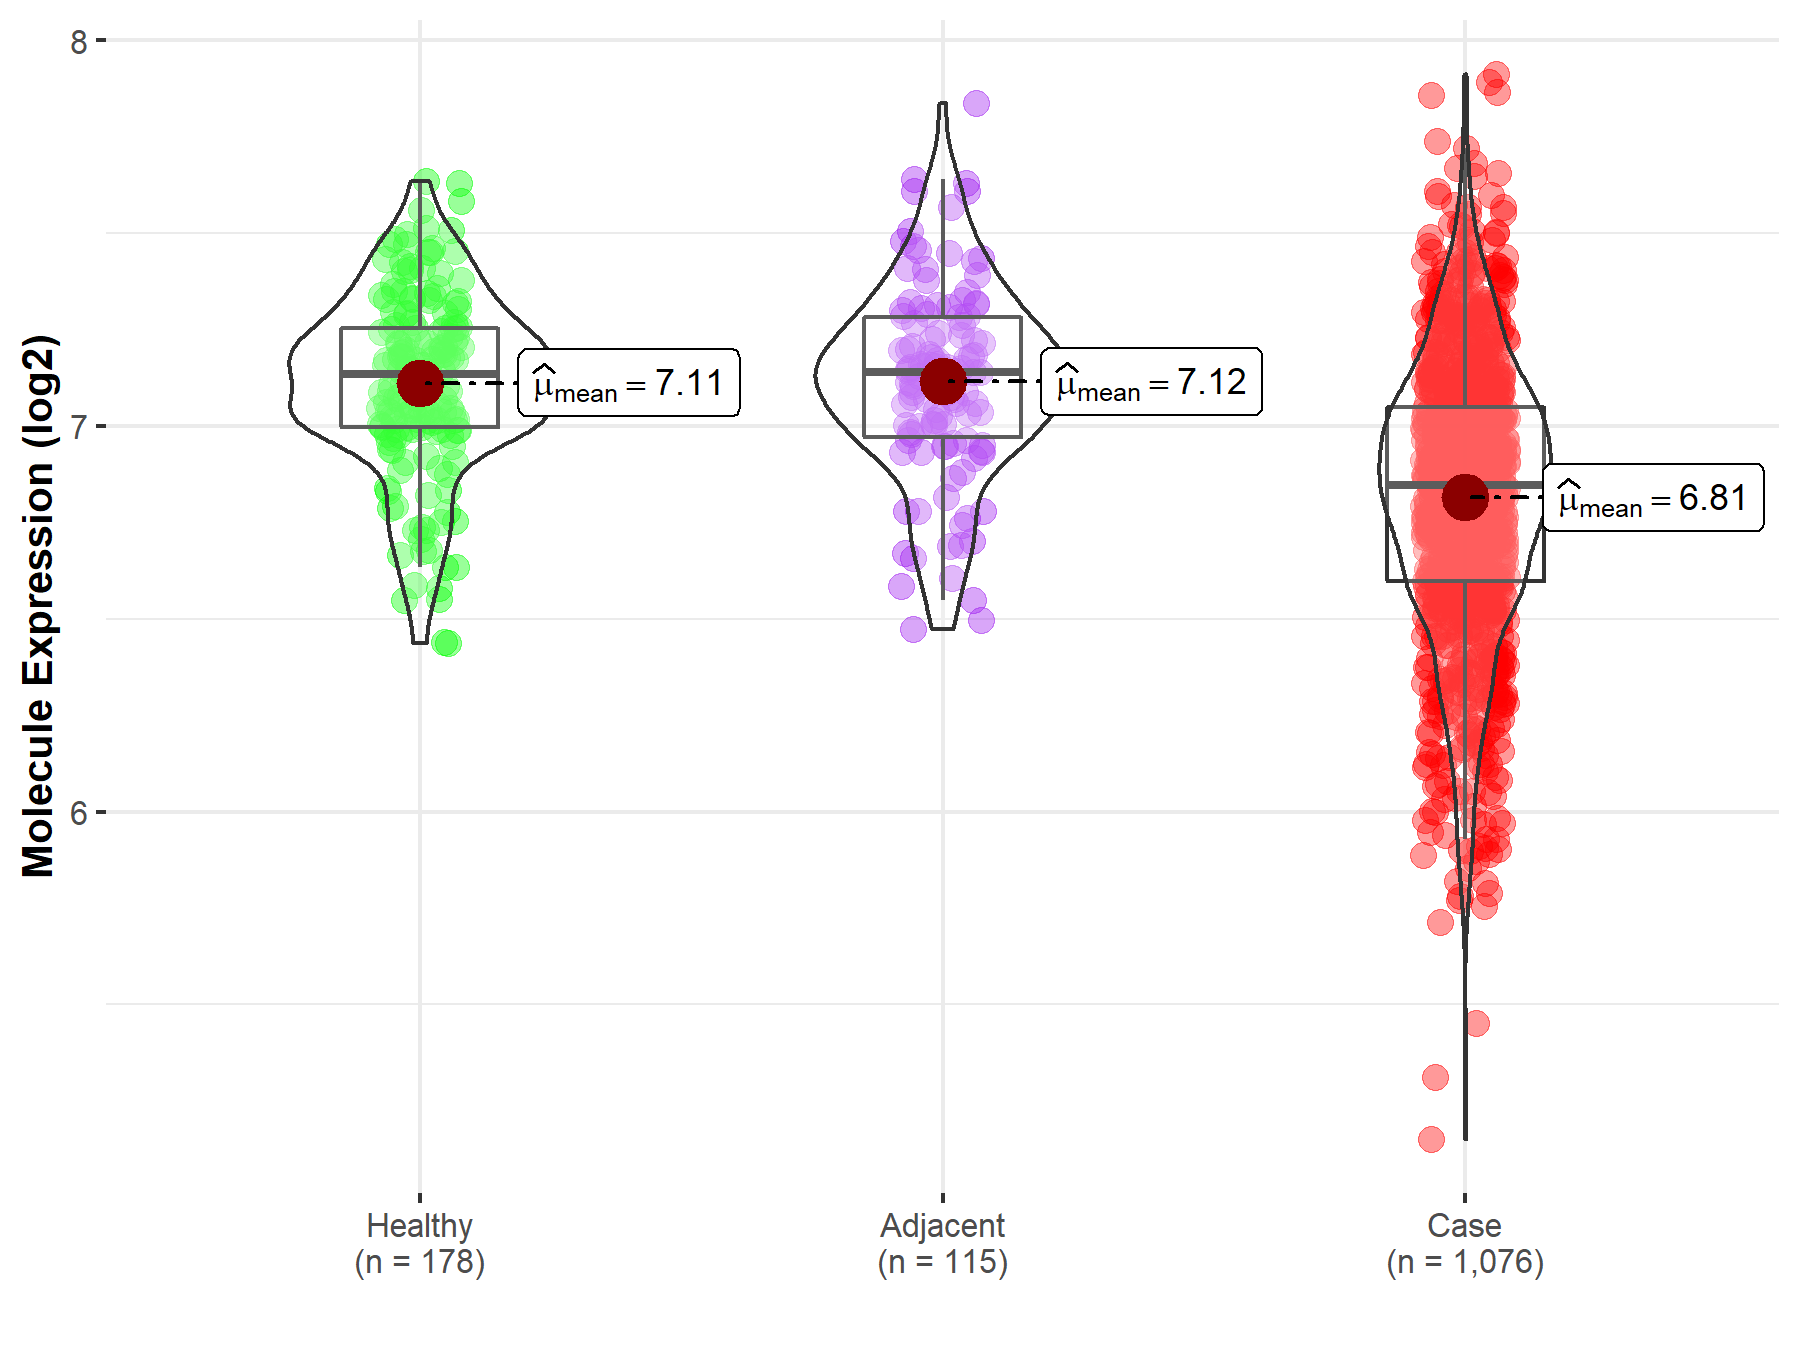
| Differential expression of molecule in resistant diseases | ||
| The Studied Tissue | Lung | |
| The Specified Disease | Lung cancer | |
| The Expression Level of Disease Section Compare with the Healthy Individual Tissue | p-value: 1.19E-36; Fold-change: -2.88E-01; Z-score: -1.23E+00 | |
| The Expression Level of Disease Section Compare with the Adjacent Tissue | p-value: 9.57E-23; Fold-change: -2.94E-01; Z-score: -1.15E+00 | |
|
Molecule expression in the normal tissue adjacent to the diseased tissue of patients
Molecule expression in the diseased tissue of patients
Molecule expression in the normal tissue of healthy individuals
|
||
| Disease-specific Molecule Abundances |
|
Click to View the Clearer Original Diagram |
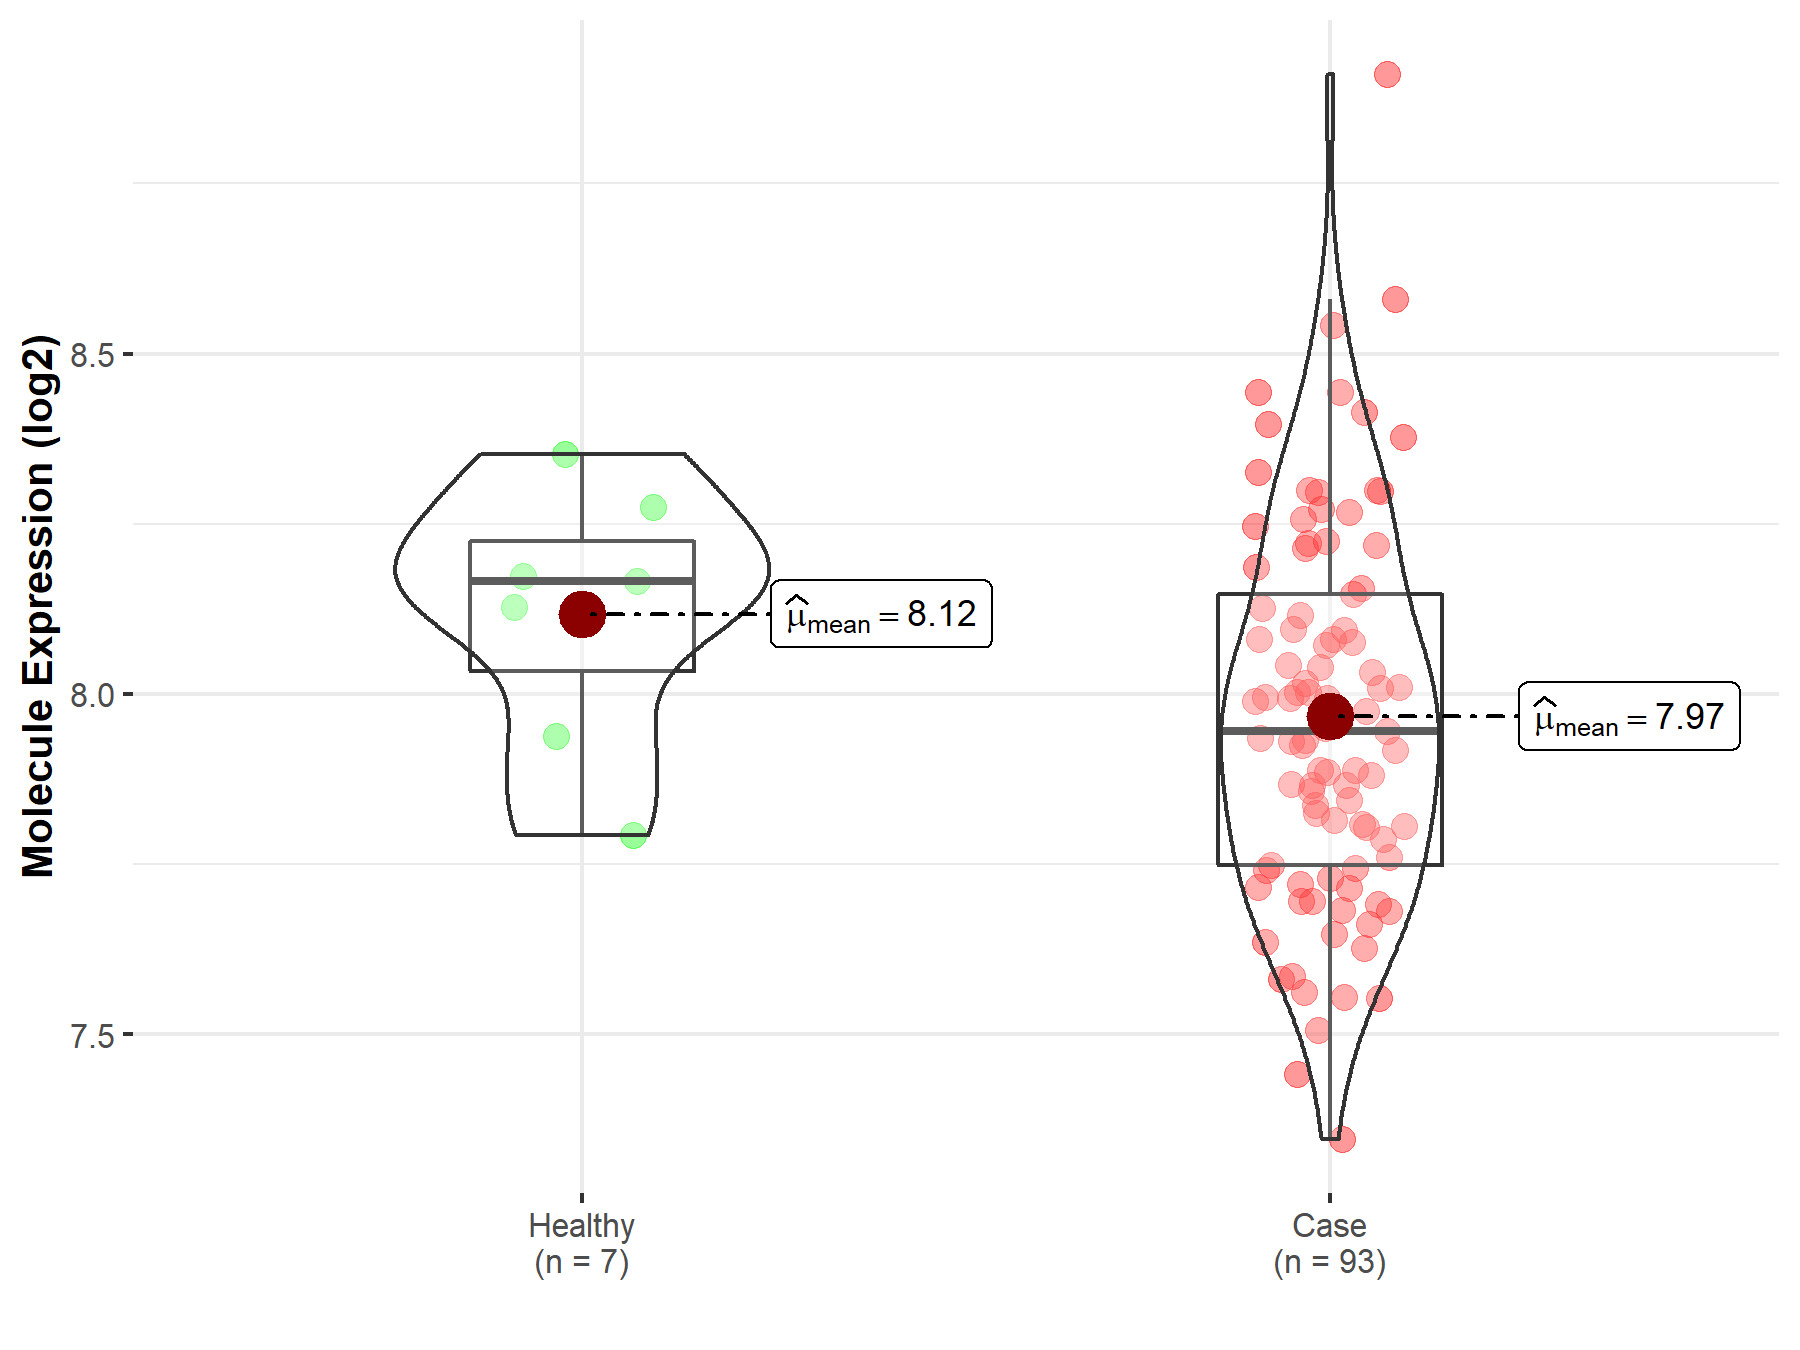
| Differential expression of molecule in resistant diseases | ||
| The Studied Tissue | Bladder tissue | |
| The Specified Disease | Bladder cancer | |
| The Expression Level of Disease Section Compare with the Healthy Individual Tissue | p-value: 9.18E-02; Fold-change: -2.20E-01; Z-score: -1.14E+00 | |
|
Molecule expression in the diseased tissue of patients
Molecule expression in the normal tissue of healthy individuals
|
||
| Disease-specific Molecule Abundances |
|
Click to View the Clearer Original Diagram |
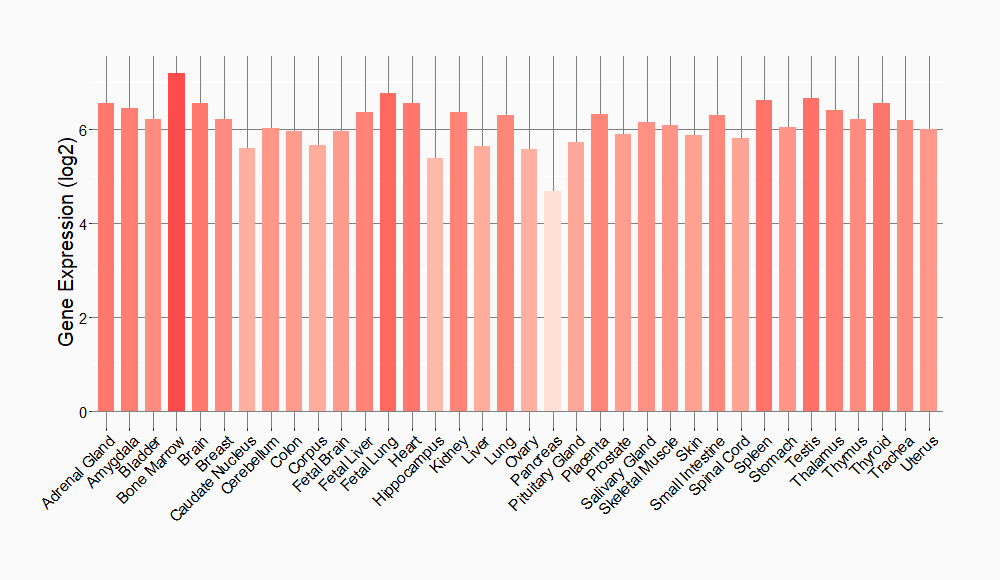
Tissue-specific Molecule Abundances in Healthy Individuals

|
||
References
If you find any error in data or bug in web service, please kindly report it to Dr. Sun and Dr. Yu.
